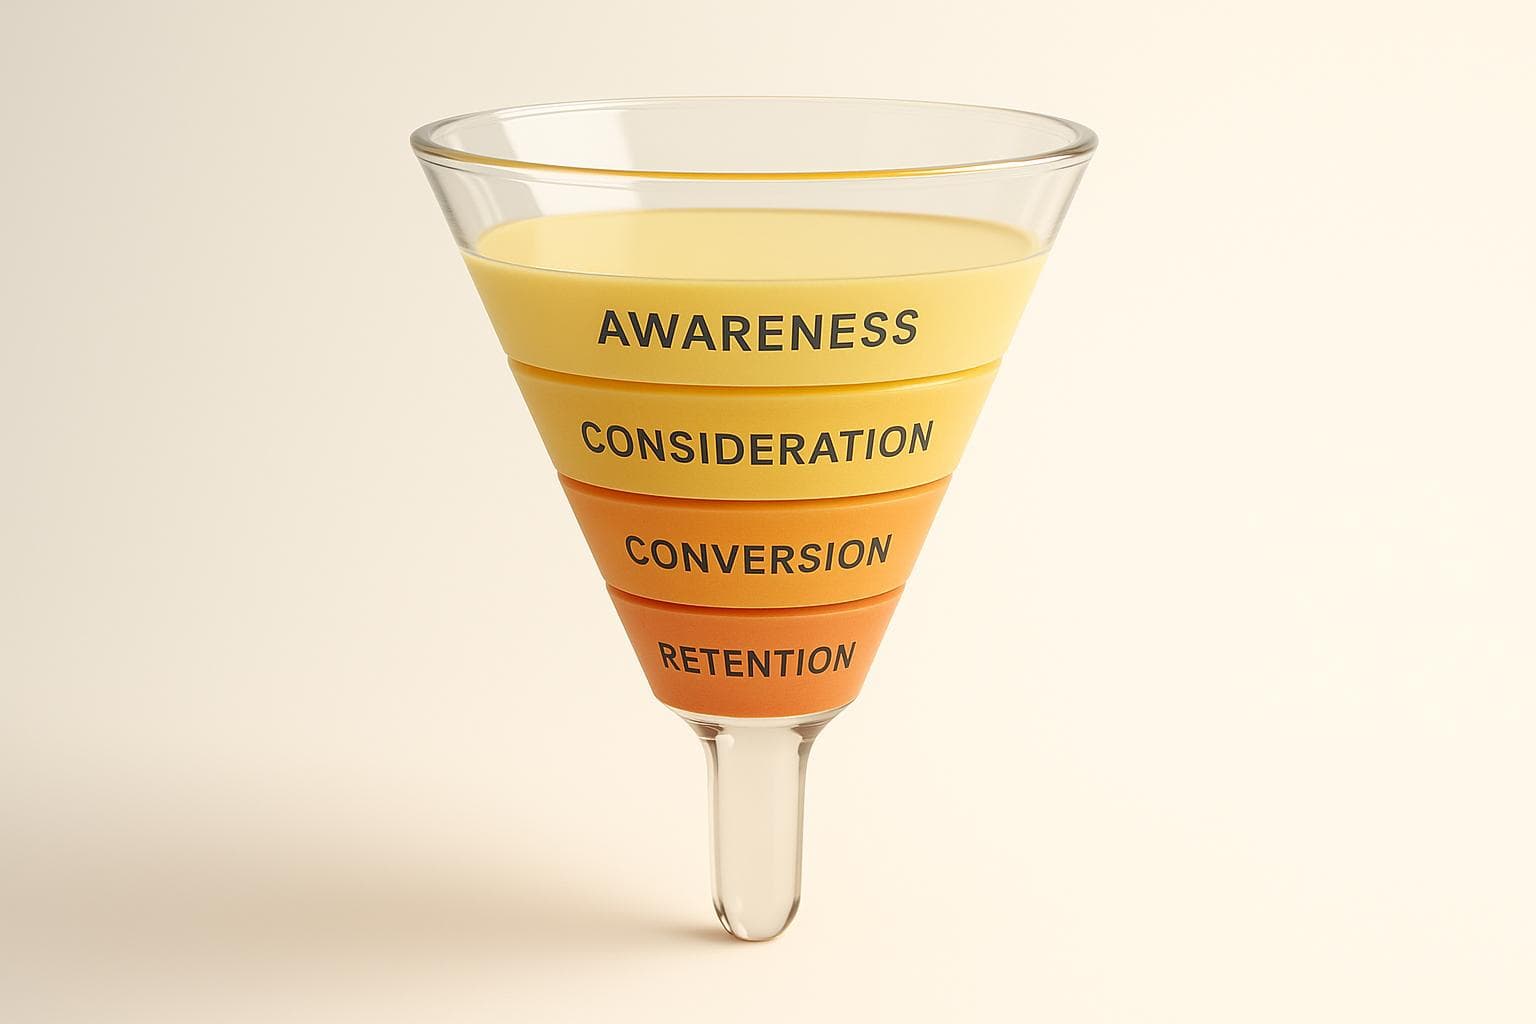
Checklist of funnel metrics for e-commerce ads
Checklist of advertising KPI by stage of the e-commerce funnel: awareness, consideration, conversion and retention.
Each stage of the e-commerce funnel (awareness, consideration, conversion, retention) relies on key data to maximize your advertising performance. Without these indicators, you risk investing blindly.
Key points :
- Awareness : Analyze traffic, reach, and cost per click (CPC). A CTR > 2 % and a CPC around 0,50 € to 2 € are solid benchmarks.
- Consideration : Measure product engagement (page views, internal search) and purchase intent (add-to-cart rate, email captures).
- Conversion : Track cart abandonment (< 60 % ideally) and the checkout completion rate.
- Retention : Evaluate CLV (customer lifetime value), repurchase rate (20-30 %) and customer satisfaction (NPS).
Result :
With a tool like Feedcast, centralize your advertising data (ROAS, CPC, ad spend) to identify bottlenecks and adjust your campaigns in real time. This allows you to increase revenue while optimizing costs.
::: @figure 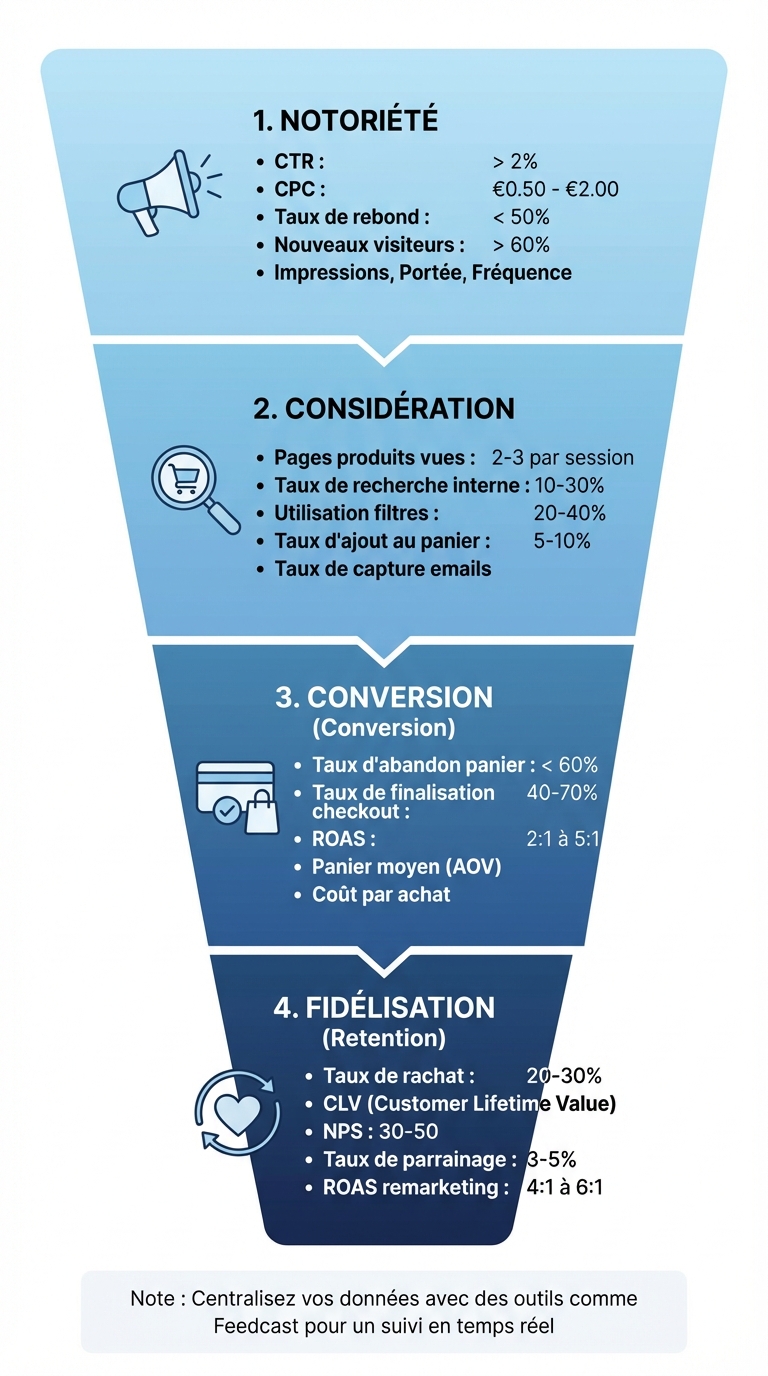 {E-commerce Funnel Metrics: Key KPIs by Stage (Awareness to Retention)}
[SMX] Funnels GA4 to boost your conversion rate
Metrics checklist for the awareness stage
Awareness corresponds to the first touchpoint with your audience. It is measured through traffic, the efficiency of ad spend, and early signs of engagement.
Traffic and reach
At this stage, it's crucial to measure the size of your audience and its initial receptiveness. The sessions generated by your campaigns are a key indicator to assess volume. Other important metrics include impressions (the total number of times your ads are displayed), reach (the number of unique users exposed to your ads) and frequency (the average number of exposures per user). For example, a campaign Meta Ads generating 10 000 impressions with a reach of 5 000 users results in a frequency of 2, which is reasonable to avoid ad saturation [2][6].
Another relevant indicator is the ratio between new visitors and known visitors, which helps evaluate the expansion of your audience. If more than 60 % of visitors are new, that reflects good performance in terms of awareness [2][12]. Thanks to Feedcast, this data can be analyzed in real time via a centralized dashboard, thus facilitating multi-channel performance tracking [1].
This traffic and reach data lays the foundation for analyzing the financial impact of your campaigns.
Cost and efficiency
To evaluate the effectiveness of your ad investments, focus on indicators like CPC (cost per click), CPM (cost per 1 000 impressions) and CTR (click-through rate). In France, a CPC between 0,50 € and 2,00 € and a CTR above 2 % are considered solid benchmarks [3][2]. Feedcast, thanks to its AI optimization and its partnership with Google CSS, displays an average CPC of 0,34 €, well below the 0,85 € standard, notably thanks to an automatic 20 % reduction on Google Shopping bids [1].
Another indicator to monitor is cost per session, obtained by dividing ad spend by the number of sessions generated. With 135 000 € of ad spend managed across multiple channels, Feedcast allows you to compare these metrics instantly across different platforms to identify the most profitable sources [1].
Once this financial data has been analyzed, it's time to look at visitor engagement on your landing pages.
Engagement sur la page de destination
Visitor engagement on your site can be evaluated using several indicators, such as the bounce rate (the percentage of visitors who leave after viewing a single page), time on site, and pages per session. A bounce rate below 50 % is generally a sign that your ad and landing page are well aligned [2][13]. If this rate exceeds 70 % for a specific campaign, it is recommended to check elements like message consistency between the ad and the page, load speed, and mobile experience [9][13].
In e-commerce, it is useful to track micro-conversions aligned with awareness objectives, such as newsletter sign-ups, product category views, or adds to a wishlist. These events, tracked in GA4, provide a more qualitative view of traffic beyond simple page visits [10][13].
Liste de contrôle des métriques pour l'étape de considération
Once awareness is established, the consideration stage aims to turn initial curiosity into more concrete interest. This involves evaluating user engagement with your products and their purchase intent. Here’s how to measure the impact of your ads at this stage.
Découverte et engagement produit
Start by monitoring the number of product pages viewed per session. Ideally, users should view between 2 and 3 pages per session. If this number is below 2, it may indicate unintuitive navigation [14]. The internal search rate is also crucial: it is the percentage of sessions where visitors use the search bar (sessions with search ÷ total sessions). A rate between 10 % and 30 % on desktop is common and often reflects stronger purchase intent [15, 14].
Another key indicator is the use of filters and sorting on category pages. When 20 to 40 % of sessions use these tools, it shows visitors are effectively narrowing their choices [12]. Finally, scroll depth on product pages reveals whether users reach critical sections like the price including tax, customer reviews, or the "add to cart" button. Well-optimized sites record a scroll rate up to 75 % for 40 to 60 % of visitors. If this number drops below 30 %, it may indicate content that is too dense or a mobile experience that needs revising [2, 13].
These exploration metrics help better understand visitor behavior before focusing on purchase-intent indicators.
Comportement d'intention et de présélection
To evaluate purchase intent, examine metrics like the add-to-cart rate (sessions that added an item ÷ sessions that viewed at least one product page), wishlist additions, and email capture [7, 13, 15]. Wishlists are particularly useful for identifying medium- or long-term intent, ideal for your remarketing campaigns.
The email capture rate (new subscribers ÷ total sessions) is another essential indicator, especially for visitors who have not yet purchased [14]. In France, it is important to respect the double opt-in and include consent text compliant with the RGPD. Test different incentives to maximize sign-ups: promo codes in euros, free shipping, or priority access to private sales.
Once these intents are measured, you can compare the effectiveness of different channels to optimize your investments.
Performance par canal et campagne
To analyze the effectiveness of advertising sources before purchase, track the conversion rate to add-to-cart by channel [15, 6]. The cost per add to cart (CPATC) – calculated by dividing ad spend by the number of add-to-cart events – is an excellent way to compare the economic performance of platforms like Google, Meta, or Microsoft Ads [8].
It is also useful to evaluate view-assisted versus click-assisted conversions. For example, a user may see an ad on Meta without clicking, but later return via Google to add a product to the cart [6]. Tools like Feedcast.ai centralize these multi-channel data in a single dashboard. This allows you to compare add-to-cart rates and CPATC across platforms. With AI-based features like segmentation by device or audience, you’ll quickly identify friction points in the customer journey and can adjust your budgets accordingly.
Checklist of metrics for the conversion stage
The conversion stage turns purchase intent into a concrete action, while highlighting the obstacles that slow down your sales. Closely tracking each step — from cart to order confirmation — helps identify points of friction.
Cart progression and checkout funnel
The cart initiation rate measures the percentage of sessions where a product is added to the cart (sessions with add-to-cart ÷ total sessions × 100)[6]. Next, the checkout funnel initiation rate assesses how many of those carts reach the first step of the order process (sessions arriving at checkout ÷ sessions with cart × 100)[6]. These indicators show the effectiveness of the early stages of the purchase process.
The cart abandonment rate is essential: it represents the share of carts created that never reach the checkout[5][12]. The formula is simple: 1 − (checkouts initiated ÷ carts created). A well-performing site often aims for a rate below 60%. Similarly, the checkout abandonment rate reflects the proportion of orders not completed: 1 − (orders completed ÷ checkouts initiated)[5][12]. These data, segmented by device (mobile often being more problematic), traffic source, or product category, allow you to precisely target areas to optimize[5][12].
Abandonments between cart and checkout are often due to unexpected shipping fees or the requirement to create an account. Conversely, checkout abandonments signal technical issues: forms that are too complex, limited payment options (card, PayPal) or lack of trust[9][11][12][13]. Displaying shipping fees in euros from the start and offering a free shipping threshold are effective solutions to reduce these abandonments[3][5].
Once progression through the checkout funnel has been analyzed, it is crucial to look at payment-related indicators to finalize the transaction.
Payment and order completion
These metrics evaluate the smoothness of the final step of the purchase process. The purchase conversion rate (or checkout completion rate) is calculated by dividing completed orders by checkouts initiated × 100[5][6]. This indicator reflects the overall performance of the checkout funnel.
The payment failure rate measures the share of unsuccessful payment attempts (failed attempts ÷ total attempts × 100)[12]. In France, factors such as 3D Secure and Strong Customer Authentication (SCA) often increase this rate, particularly on mobile[12][8][13]. Analyzing this data by payment method (card, PayPal, Klarna) and by issuing bank can reveal specific technical problems.
Another key indicator is the return or refund initiation rate, which measures the share of orders for which a return is requested within a given period, for example 30 days (orders with an open return ÷ total orders × 100)[13]. High rates for certain campaigns or categories can indicate issues such as mismatches between the advertising and the real product, incorrect sizing (notably in apparel) or insufficient descriptions[13]. It is important to put this rate in perspective with margin: some high-margin categories can tolerate a higher return rate if overall revenue remains attractive.
Revenue and value metrics
To evaluate conversion quality, calculate the average order value (AOV) – total revenue ÷ number of orders – and revenue per session – total revenue ÷ number of sessions[5][7][13]. For example, a channel with a modest conversion rate can generate high revenue per session thanks to a higher average order value.
The conversion rate by channel or product category (sessions with a purchase from a channel or category ÷ total sessions for that channel or category × 100) lets you compare the effectiveness of different channels. Pair this rate with cost per purchase (ad spend ÷ number of purchases) and ROAS (revenue attributed to ads ÷ ad spend) to optimize your budgets[5][8]. For example, if Google Shopping generates 10 000 € in revenue for 2 000 € of spend (ROAS 5:1) and retargeting on Meta brings in 4 000 € for 400 € (ROAS 10:1), you might allocate more budget to retargeting while monitoring frequency[8].
Tools like Feedcast.ai allow you to centralize this multi-channel data in a single dashboard. This makes it easy to compare ROAS, cost per purchase, and revenue per session across Google, Meta, and Microsoft, and to quickly reallocate budgets toward the best-performing channel-audience-product combinations. By aligning these indicators with your acquisition and retention strategies, you optimize your entire purchase funnel.
sbb-itb-0bd1697
Post-purchase and retention metrics checklist
Once the conversion is made, it’s essential to measure retention to maximize long-term value. After the first order, the goal becomes clear: turn a one-time buyer into a loyal customer. Post-purchase metrics play a key role in understanding whether your ad campaigns are attracting long-term customers or just occasional buyers. These data allow you to adjust your ad budgets and focus efforts on the channels that generate the most valuable customers.
Customer value and loyalty
After a purchase, assessing customer value and loyalty is fundamental. CLV (Customer Lifetime Value) estimates the revenue a customer generates over the course of their relationship with your brand. It is calculated by multiplying average order value by purchase frequency and by the average customer lifespan [8][13]. For example, a customer spending on average 75 € for three purchases per year over four years will have a CLV of 900 €. Segmenting this metric by acquisition channel can reveal notable differences. For example, customers acquired via Google Shopping often show a CLV 25 to 30% higher thanks to initiatives like targeted loyalty programs [5].
The repurchase rate indicates the proportion of customers who make at least two purchases within a given period (for example, 90 days) and is calculated as:
(Number of customers with ≥2 purchases ÷ Total customers) × 100 [2][6]. In e-commerce, this rate typically ranges between 20 and 30%. However, efforts like personalized emails or exclusive offers can push it beyond 40%. A Shopify store, for example, saw its rate rise from 15% to 35% thanks to tailored remarketing campaigns [4].
The time between purchases measures the average time between the first order and subsequent ones. In the apparel sector, a timeframe of 20 to 45 days is often a sign of loyalty [2]. By optimizing this interval, you can schedule your retargeting campaigns at the ideal moment. For example, a cosmetics brand that followed up with customers 28 days after purchase observed an 18% increase in its repurchase rate [6].
Satisfaction et recommandation
Le Net Promoter Score (NPS) est un indicateur clé pour évaluer la satisfaction client. Il repose sur une question simple : « Sur une échelle de 0 à 10, recommanderiez-vous notre boutique ? ». Le score se calcule en soustrayant le pourcentage de détracteurs (notes 0–6) de celui des promoteurs (notes 9–10) [4][9][13]. Les boutiques e-commerce performantes atteignent souvent un NPS entre 30 et 50. Il est conseillé d’envoyer cette enquête par e-mail après la livraison. Un score inférieur à 20 peut signaler un risque de désabonnement, notamment parmi les clients acquis via des publicités [3].
Le taux de soumission d’avis se calcule comme suit :
(Nombre d’avis ÷ Total des commandes) × 100. En général, ce taux varie entre 1 et 5 %. Cependant, l’automatisation des e-mails post-achat, l’ajout d’incitations (comme des réductions) et des formulaires simplifiés peuvent doubler ce chiffre [4][6]. Par exemple, une boutique de gadgets qui envoie des relances SMS après livraison a atteint un taux de soumission de 8 %, ce qui a contribué à une augmentation de 15 % des ventes répétées [13].
Le taux de parrainage mesure la proportion de nouveaux clients obtenus grâce aux recommandations :
(Nouveaux clients parrainés ÷ Total des nouveaux clients) × 100. Pour un e-commerce bien établi, ce chiffre varie entre 3 et 5 %, mais peut atteindre 10 % avec un programme de parrainage actif [6]. Ces campagnes offrent souvent un retour sur investissement publicitaire (ROAS) jusqu’à trois fois supérieur [8].
Ces indicateurs de satisfaction permettent de poser des bases solides pour améliorer vos stratégies de fidélisation.
Performance publicitaire et fidélisation
Le ROAS par cohorte client analyse le retour sur investissement publicitaire en segmentant les clients selon leur canal ou période d’acquisition (par exemple, clients Meta du T1 2025 vs clients Google du T2 2025). En suivant les revenus générés sur plusieurs mois par chaque cohorte, on remarque que les campagnes orientées fidélisation atteignent souvent un ROAS de 4:1 à 6:1, contre 2:1 à 3:1 pour les campagnes d’acquisition [8]. Des outils comme Feedcast.ai permettent de centraliser ces données, facilitant les comparaisons entre Google, Meta et Microsoft pour une meilleure analyse post-achat.
La part du revenu issue du remarketing se calcule ainsi :
(Revenu remarketing ÷ Revenu total) × 100. Une part saine se situe généralement entre 20 et 40 % dans un entonnoir optimisé [6]. En utilisant des outils d’attribution comme Meta Pixel ou Google Ads, une boutique qui porte cette part à 30 % peut réduire son coût d’acquisition client de 50 % [2].
Enfin, les taux d’ouverture des séquences post-achat (e-mails ou SMS, comme les messages de remerciement ou les rappels de réapprovisionnement) varient en moyenne entre 20 et 30 % pour les e-mails et entre 10 et 20 % pour les SMS [2][4]. En personnalisant les contenus, en programmant les envois entre 3 et 7 jours après l’achat et en testant différents objets, il est possible d’atteindre un taux d’ouverture supérieur à 25 %, ce qui peut augmenter les rachats de 15 à 20 %.
Cross-funnel diagnostic checklist
With the data in hand, it is time to identify bottlenecks in the customer journey and prioritize optimizations. The cross-funnel diagnostic consists of examining each step of the user journey to understand where and why users drop off. This allows you to invest your advertising resources where they will have the greatest impact on your revenue.
Identify break points in the funnel
Visualize the entire funnel (sessions → view_item → add_to_cart → begin_checkout → purchase) and calculate the conversion and drop-off rates at each step[7]. For example, if 10 000 sessions result in 3 000 view_item, that represents a conversion rate of 30 % and a drop-off of 70 % at that stage[7]. Focus your efforts on the stages where the number of users lost is highest and where conversion rates are well below standards. For example, an add-to-cart rate between 5 and 10 %, or a checkout completion rate between 40 and 70 %, can indicate a problem[14]. Funnel analysis tools will help you spot these critical points.
Segment the data for precise insights
Once metrics are analyzed, segment your data to detect specific issues. Review your results by channel (Google Ads, Meta Ads, Microsoft Ads, SEO), by campaign, by device type (desktop, mobile, tablet), by location (France or specific regions), by product category or by user type (new vs returning)[14]. This segmentation can reveal problems hidden by overall averages. For example, an overall checkout completion rate of 60 % may hide a rate of only 35 % on mobile for traffic coming from Meta Ads, which could indicate a UX or tracking issue. Similarly, a high abandonment rate on categories like bulky furniture may be linked to excessive shipping costs or delivery times. Finally, gaps between new users and returning customers can signal weaknesses in messaging or offers at certain stages of the journey[14].
Prioritize actions based on impact
Rely on an impact × effort matrix to prioritize your actions based on their revenue potential. For each problematic step, estimate: (1) the current conversion rate, (2) a realistic target rate (based on benchmarks or your best performances), (3) the number of users affected, and (4) the average basket value in euros[14]. Then calculate the potential monthly gain: (number of users × average basket × (target rate – current rate)).
Take an example: a French fashion shop records 50 000 sessions per month, 20 000 viewing events, 4 000 add_to_cart, 2 000 begin_checkout and 1 000 purchases, with an average basket of 80 €. If the conversion rate between begin_checkout and purchase is 50 %, but benchmarks indicate a target of 65 %, the potential gain would be: 2 000 × (0,65 – 0,50) × 80 € = 2 400 € per month. If a UX analysis shows many users abandon at the delivery step due to unexpected fees or the absence of pickup points like Mondial Relay, it would be wise to display those fees upfront and offer pickup point delivery options. A moderate-effort but high-impact solution[7].
Once your priorities are defined, centralize your measurements for continuous monitoring.
Centralize data and metrics
Bring together your ad spend, clicks, sessions and conversion events for all your channels (Google Ads, Meta Ads, Microsoft Ads) with your analytics data and revenues in a unified view[2]. Tools like Feedcast make it easy to connect Google, Meta and Microsoft Ads, sync product feeds and visualize funnel performance in a single dashboard. For example, a consolidated dashboard can display your spend, ROAS and CPC for each channel in real time. This overview makes it easier to compare performance, quickly identify anomalies (like a sudden drop in add_to_cart on a channel) and calculate accurate cross-channel ROAS or the CLV:CAC ratio to better allocate your budget. Also set up automatic alerts to be notified when key metrics like checkout completion rate, total revenue or add-to-cart rate deviate from your defined thresholds compared to the previous period.
Conclusion: use metrics to optimize e-commerce ad funnels
Adopting rigorous tracking at each step of an ad funnel turns approximate management into a data-driven strategy. This not only enables you to quickly identify drop-off points, but also to address them effectively.
For example: a high abandonment rate early in the funnel or low completion can signal traffic issues or obstacles in the payment process. Moreover, significant differences between the performance of different channels or devices (such as mobile and desktop) highlight the importance of segmenting your analyses by channel, device, and audience. This segmentation helps refine targeting and improve the user experience.
A tool like the unified dashboard offered by Feedcast simplifies this task. It centralizes your ad accounts and displays, in real time, essential metrics such as spend, ROAS, or CPC. This overview makes it easier to detect anomalies quickly and reallocate budgets to the best-performing campaigns. This centralization becomes a major asset for establishing a continuous optimization cycle.
Optimization relies on an iterative process: test, measure, and adjust. For example, if you identify frequent drop-off at checkout, you could test a hypothesis such as showing shipping costs earlier in the journey. Then measure the impact of that change on key indicators like conversion rate or average order value. Companies that adopt this structured method often see concrete results: improved ROAS, lower CPC, and higher repurchase rates. This continuous improvement cycle becomes a core pillar of your strategy.
Finally, align your metrics with your business objectives. If your priority is growth, focus on metrics like CAC, ROAS, and conversion rate. If you aim for profitability, prioritize data such as margin per order, average order value, or CLV. With well-defined metrics and centralized tracking, every euro invested becomes a measurable lever to optimize your performance.
FAQs
How can I improve the conversion rate of my e-commerce funnel?
To boost the conversion rate of your e-commerce funnel, start by optimizing your product data using artificial intelligence. This makes your products more visible and, above all, more relevant to customers. In short, better-suited descriptions and improved categorization can make all the difference.
Next, focus on targeted ad campaigns. The idea is to capture the attention of potential customers at every stage of their buying journey. A well-crafted ad can turn a simple visitor into a loyal customer.
Finally, simplify ad management by using centralized tools. With unified dashboards, you can monitor campaign performance at a glance. This allows you to quickly detect what works or doesn't and adjust your strategies in real time to maximize results.
What are the key metrics to track and improve customer retention in e-commerce?
To strengthen customer loyalty in e-commerce, it’s crucial to monitor certain key metrics that help you better understand customer behavior and engagement:
- Repurchase rate: This metric reveals the proportion of customers who return to make one or more additional purchases. A high rate is often a sign of a good customer experience.
- Customer lifetime value (CLV): This metric measures the total value a customer generates over the course of their relationship with your business. It helps evaluate the long-term profitability of your retention efforts.
- Retention rate: This reflects your ability to keep customers over a given period. An increase in this rate can indicate higher satisfaction and attachment to your brand.
- Customer satisfaction (CSAT/NPS): These tools collect customers’ direct impressions, whether it's their level of satisfaction or their likelihood to recommend your business to others.
By regularly reviewing these metrics, you will be able to identify areas for improvement and adjust your marketing strategies to better meet customer expectations.
How do I spot and remove obstacles in the online purchase journey?
To identify and eliminate obstacles in the purchase journey, it's essential to closely examine performance data at each stage of the conversion funnel. Use analytics tools to spot the moments when customers drop off, whether during browsing, product selection, or at payment. This information will allow you to pinpoint the problematic areas.
Once these obstacles are identified, work to simplify the process. For example, reduce the number of clicks required to complete an action, clarify the available information, and strengthen customer trust by integrating elements like customer reviews or guarantees. To go further, a platform like Feedcast.ai can support you by automating and centralizing the management of your ad campaigns, which makes quick adjustments easier and helps smooth the user experience.
Geoffrey G.