10 Content Metrics for E-commerce Funnels
Learn the top 10 essential metrics for optimizing your e-commerce funnel, from traffic to customer lifetime value, and boost your conversions.
Optimizing your e-commerce funnel means understanding how customers move from awareness to purchase. Tracking the right metrics at each stage helps you identify issues and opportunities to boost conversions and revenue. Here are the 10 essential metrics every e-commerce business should measure:
- Website Traffic: Tracks how many visitors your site attracts and which channels perform best.
- Bounce Rate: Measures the percentage of visitors who leave after viewing one page, revealing engagement levels.
- Product Page Views: Indicates interest in specific products and site navigation effectiveness.
- Add-to-Cart Rate: Tracks the percentage of visitors adding items to their cart, showing purchase intent.
- Checkout Abandonment Rate: Highlights where shoppers drop off during checkout.
- Conversion Rate: Measures how many visitors complete a purchase.
- Conversion Rate by Channel: Pinpoints which traffic sources drive the most sales.
- Average Order Value (AOV): Tracks the average spend per transaction.
- Leads Generated: Counts potential customers who share contact details for future engagement.
- Customer Lifetime Value (CLV): Measures total revenue generated by a customer over time.
Quick Overview
- Top Priority: Focus on metrics that align with your goals (e.g., traffic for growth, CLV for long-term success).
- Tools: Use platforms like Google Analytics or Feedcast.ai for real-time tracking and actionable insights.
- Key Tip: Start by optimizing 3–5 metrics that directly impact revenue or customer retention.
These metrics provide a roadmap to refine your funnel, improve user experience, and increase sales.
Ecommerce Marketing Analytics: Top 8 Metrics EXPLAINED
1. Website Traffic
Website traffic measures all visitors to your site, encompassing both new and returning users. It's the heartbeat of your online presence, offering a snapshot of how many people are engaging with your website.
Funnel Stage Relevance
Traffic plays a pivotal role in the awareness stage of your conversion funnel. It reflects how effectively your marketing efforts are pulling potential customers to your digital storefront. But here's the catch: it's not just about the numbers. Attracting visitors who are genuinely interested in what you offer is far more valuable than simply chasing high traffic volumes.
Actionable Insights Provided
Traffic analysis provides a treasure trove of insights. By studying where your visitors come from - whether it's paid ads, organic search, social media, or email - you can identify which channels are delivering results. This knowledge helps you fine-tune your marketing strategies and allocate your budget more effectively.
Traffic trends also reveal seasonal patterns. For example, spikes during events like Black Friday or the holiday season can signal the need to ramp up inventory, adjust staffing, or increase advertising. Geographic data can further refine strategies, allowing you to tailor shipping options or marketing campaigns to specific regions.
Impact on E-commerce Performance
The quality of your traffic is just as important as the quantity. High traffic only translates into revenue if those visitors align with your target audience. Additionally, a larger pool of visitors provides more data for optimizing ad campaigns and can enhance organic search rankings through increased engagement.
On the flip side, limited traffic can be a bottleneck. Without enough visitors, testing and improving other funnel metrics - like product page layouts or checkout processes - becomes challenging. A robust flow of traffic is essential for running meaningful A/B tests and refining your overall strategy.
Ease of Tracking and Analysis
Tracking website traffic is straightforward thanks to tools like Google Analytics, which offer detailed insights into visitor numbers, traffic sources, geographic locations, and device types - all for free. Many e-commerce platforms, such as Shopify and WooCommerce, also include built-in traffic reporting features.
For a more streamlined approach, platforms like Feedcast.ai consolidate data from multiple sources into a single dashboard, making it easier to monitor performance. Real-time traffic tracking is another game-changer. If an ad campaign suddenly stops driving visitors, you can act quickly to adjust your strategy, ensuring you don’t miss out on revenue opportunities. Reliable traffic tracking is the foundation for continuous improvement across your funnel.
2. Bounce Rate
Once you’ve grasped traffic trends, bounce rate offers a closer look at how visitors interact with your site. It’s the percentage of users who leave after viewing just one page - without clicking links, filling out forms, or making purchases. Essentially, it’s a quick indicator of how many visitors take a glance and decide not to stick around.
Funnel Stage Relevance
Bounce rate becomes especially useful when you’re trying to understand how well your content keeps visitors engaged. At the awareness and interest stages of the funnel, it reflects the effectiveness of your initial touchpoints - whether visitors arrive via search, social media, or ads. A high bounce rate here might mean your content isn’t grabbing attention or aligning with what users expected to find.
For product pages, bounce rate is even more telling. If someone lands on a product page and leaves right away, it might signal a disconnect between their expectations and what they see. This could stem from issues like slow loading speeds, clunky design, or a mismatch between their search query and the product details.
Actionable Insights Provided
Analyzing bounce rate can uncover valuable insights about how well your content resonates with your audience. For example:
- Segmenting bounce rates by traffic source can show which channels are attracting engaged visitors. If some sources underperform, it might be time to tweak your targeting or messaging.
- Looking at bounce rates for individual pages can highlight areas for improvement. If your homepage keeps visitors engaged but blog posts see quick exits, it might be worth revisiting how those posts are structured or presented.
- Comparing bounce rates across devices can reveal technical issues. If mobile users are bouncing more often than desktop users, it could point to problems like slow load times, difficult navigation, or poor formatting on smaller screens.
Impact on E-commerce Performance
Bounce rate plays a big role in how well your e-commerce site performs. Generally, higher bounce rates mean fewer conversions. If visitors leave too quickly, they’re not sticking around to buy anything. That said, context is key. On content-heavy pages like blog posts, a higher bounce rate might not be as concerning if users still gain value in a short visit. On product pages, however, a high bounce rate often means missed sales opportunities.
Persistent high bounce rates can also hurt your SEO. Search engines may see it as a sign that your content isn’t meeting user intent, which can lead to lower rankings and less relevant traffic over time. On top of that, high bounce rates can make your ad spend less efficient by raising the cost per engaged visitor. Addressing these issues can boost both your conversion rates and your advertising ROI.
Ease of Tracking and Analysis
Tracking bounce rate is easier than ever with tools like Google Analytics and other unified platforms. These tools let you break down bounce rate by page, traffic source, and device, giving you a clear picture of what’s working and what’s not - all in one place.
Regular tracking also helps you set benchmarks. Once you know the typical bounce rate for your key pages, it’s easier to spot underperforming areas that need work and identify high-performing pages you can learn from.
3. Product Page Views
Product page views tell you how often visitors land on specific product pages, offering a clear indication of genuine shopping intent - beyond just general site traffic.
Funnel Stage Relevance
Product page views are a key metric in the consideration stage of the buyer's journey. When someone clicks on a product, it shows they've moved beyond casual browsing and are now evaluating their options.
This metric becomes even more insightful when segmented by traffic source. For instance, visitors arriving from search engines often signal high purchase intent, while those coming from social media might still be exploring. Understanding these differences allows you to craft more tailored strategies for each source.
Additionally, product page views reflect how well your category pages, search tools, and site navigation work. If visitors are easily finding and viewing product pages, it’s a good sign that your site structure supports a natural path toward conversion.
Actionable Insights Provided
Segmenting and analyzing product page views can reveal a wealth of actionable insights. For example, high page views paired with low conversions might point to issues like pricing or lackluster content. On the flip side, products with moderate views but strong conversions could benefit from increased promotion.
Trends in product page views can also highlight seasonal shifts or emerging customer interests. For instance, a sudden spike in views for a particular category might indicate growing demand, giving you the opportunity to adjust your content calendar or promotional efforts. Similarly, underperforming products may need better descriptions, improved visuals, or bundling with popular items to boost their appeal.
Breaking down product page views by geography or demographics can uncover regional preferences, helping you fine-tune your content and campaigns for specific audiences. This is especially useful when planning targeted marketing efforts or entering new markets.
Impact on E-commerce Performance
Product page views are closely tied to sales. Visitors who spend time reviewing product details are more likely to make a purchase, emphasizing the importance of quality over sheer volume of views. This insight is invaluable for refining your sales funnel.
The metric also has implications for advertising. Products with strong organic page views often perform better in paid campaigns, while those struggling to attract attention might need content updates before you invest in promoting them. Knowing which products naturally draw interest helps you allocate your marketing budget more effectively.
From an SEO perspective, products with consistent page views - especially when paired with low bounce rates and strong engagement - tend to rank better in search results. This creates a cycle where popular products gain even more visibility, attracting additional high-intent traffic.
Ease of Tracking and Analysis
Tracking product page views is straightforward with analytics tools. Monitor views by product and category, and combine this data with metrics like time on page, bounce rate, and conversion rate. This approach helps you identify top-performing products, seasonal trends, and any technical issues that might be hindering performance.
4. Add-to-Cart Rate
The add-to-cart rate tracks the percentage of visitors who place items into their shopping cart after viewing a product page. This metric is a clear indicator of how well your product pages are turning casual browsers into potential buyers.
Funnel Stage Relevance
This metric plays a critical role in the decision stage of your e-commerce funnel. It marks the point where visitors move from merely considering a product to taking a concrete step toward purchasing it. Essentially, it captures the transition from passive interest to active buying intent.
Adding an item to the cart often involves a deliberate decision. Shoppers weigh factors like product details, pricing, and perceived value before taking this step. Because of this, the add-to-cart rate is a stronger predictor of eventual sales compared to earlier metrics in the funnel.
It’s also a valuable tool for spotting issues. For instance, if a product page sees high traffic but a low add-to-cart rate, it could signal problems like unclear pricing, weak product descriptions, or a lack of trust-building elements like reviews or return policies. These patterns are explored further in the next section.
Actionable Insights Provided
By analyzing add-to-cart rates, you can uncover patterns and make data-driven decisions. For example, comparing rates across product categories can highlight which items resonate most with your audience. Products that consistently perform well often share traits like competitive pricing, engaging descriptions, or high-quality images - elements you can replicate to improve underperforming products.
Segmenting this metric by traffic source can also be revealing. For instance, email subscribers might show higher add-to-cart rates than visitors from social media, suggesting stronger purchase intent among your existing audience. This insight allows you to fine-tune your marketing spend and tailor messages for each channel.
Tracking changes over time can uncover seasonal trends or pinpoint the best times for promotions. A sudden dip in the add-to-cart rate might signal external factors like competitor price changes or internal issues like inventory shortages or technical glitches. On the flip side, steady improvements can validate recent updates to product pages or pricing strategies.
Device-specific analysis is another key area. For example, lower rates on mobile devices might point to checkout flow problems or slow page loading times, both of which can be addressed to capture more sales.
Impact on E-commerce Performance
Improving your add-to-cart rate has a direct impact on your bottom line. A higher rate means more visitors are progressing toward making a purchase, which boosts conversion rates and lowers customer acquisition costs. This makes optimizing the add-to-cart rate an essential part of fine-tuning your overall funnel.
It also plays a role in inventory planning and demand forecasting. Products with rising add-to-cart rates indicate growing interest, which could lead to stock shortages if not managed properly. Conversely, declining rates might signal a need for promotions or updates to the product offering.
From a shopper’s perspective, a smooth and reliable add-to-cart experience builds trust in your site. When customers can easily add items to their cart, they’re more likely to follow through with the purchase and return for future shopping, increasing their lifetime value and repeat purchase rates.
Ease of Tracking and Analysis
Most e-commerce platforms automatically track add-to-cart events, making this metric easy to access through standard analytics tools. You can break down the data by product, category, time frame, or traffic source to gain a more detailed understanding of performance.
For deeper insights, combine add-to-cart data with metrics like time on page or scroll depth. This can help pinpoint whether low rates are due to insufficient product details, pricing concerns, or technical issues like a malfunctioning add-to-cart button. By taking this integrated approach, you can address the root causes and improve both the customer experience and your conversion rates.
5. Checkout Abandonment Rate
The checkout abandonment rate reflects the percentage of shoppers who start the checkout process but don’t complete it. It’s a key metric for understanding how well your e-commerce funnel performs at its final stage.
Funnel Stage Relevance
This metric is tied directly to the conversion stage of your funnel - the last chance to turn a potential customer into a paying one. By the time someone reaches the checkout, they’ve already shown strong intent to buy, having spent time browsing, comparing, and adding items to their cart. When they abandon at this point, it represents a lost opportunity with highly qualified leads. Understanding these drop-offs provides a clear path to improving your checkout process.
Actionable Insights Provided
High checkout abandonment rates can often pinpoint specific issues within the process. For example, trends by device type might reveal that your mobile checkout experience needs refinement. If users abandon frequently when only credit card payment is available, adding digital wallet options like PayPal or Apple Pay can help. Similarly, requiring account creation may drive customers away - offering a guest checkout option can encourage them to complete their purchase.
Geographic data can uncover regional challenges, such as customers abandoning due to high international shipping costs. This insight might lead to strategies like adjusting shipping fees or introducing free shipping thresholds to retain these buyers.
Time-based patterns are equally revealing. If abandonment rates spike during certain hours or days, it could indicate server slowdowns during peak traffic or the need for added support, like live chat, during busy periods.
Impact on E-commerce Performance
Reducing checkout abandonment directly increases revenue without requiring more website traffic. Even small improvements in completion rates can make a noticeable difference, as these shoppers are already deep in the funnel.
The benefits extend beyond immediate sales. A smooth checkout process encourages repeat purchases and positive word-of-mouth recommendations. On the flip side, a frustrating experience can damage your brand and reduce customer lifetime value.
This metric also plays a role in inventory and demand planning. High abandonment rates can skew demand signals, leading to overstocking items that aren’t converting into actual sales. By addressing these issues, you not only improve conversions but also streamline your inventory management.
Ultimately, checkout abandonment ties directly to your bottom line. When more visitors complete their purchases, your marketing spend becomes more efficient, leaving room for higher ad budgets or stronger profit margins.
Ease of Tracking and Analysis
Most analytics platforms make it straightforward to track checkout abandonment. You can segment data by checkout step, payment method, device type, and customer demographics to uncover specific problem areas.
More advanced tools, like funnel analysis, can pinpoint exactly where users drop off - whether it’s during shipping information entry or at the final order review. Heatmaps are another valuable tool, showing how users interact with your checkout pages and identifying confusing elements or overlooked calls-to-action.
Accurate tracking is essential for optimizing your funnel. It also enables automated recovery campaigns, like abandoned cart emails, which often convert at higher rates than acquiring new traffic. These campaigns can turn lost opportunities into completed sales, making them an important part of your overall strategy.
6. Conversion Rate
The conversion rate measures the percentage of website visitors who take a specific action - most often making a purchase. It’s calculated using the formula: (conversions ÷ visitors) × 100. This metric serves as a clear indicator of how effectively your sales funnel is performing.
Funnel Stage Relevance
Your conversion rate provides valuable insights at every stage of the funnel. At the awareness stage, it shows whether your content is attracting the right audience. During the consideration stage, it reflects how well your product pages are encouraging purchase intent. Finally, at the conversion stage, it sheds light on how smoothly your checkout process is working.
Breaking down the conversion rate by funnel stage can help identify specific problem areas. For example, if you’re getting plenty of traffic but few conversions, the issue might lie in the middle or bottom of the funnel. On the other hand, low traffic paired with a poor conversion rate could point to problems at the top of the funnel, such as ineffective outreach or irrelevant messaging.
Actionable Insights Provided
Segmenting your conversion rate by factors like traffic source, device type, product category, or geography can uncover useful trends. For instance:
- Traffic source: Analyzing which channels bring high-quality visitors can guide your marketing investments.
- Device type: Comparing desktop and mobile performance may reveal opportunities to improve the mobile shopping experience.
- Product categories and regions: Identifying high- or low-performing categories or regions can help refine inventory strategies and regional campaigns.
This kind of segmentation allows you to make better decisions about where to spend your advertising dollars, how to adjust your website, and where to focus your marketing efforts.
Impact on E-Commerce Performance
Improving your conversion rate can directly boost your business’s bottom line. When more visitors complete a purchase, each marketing dollar generates more revenue, enhancing your return on advertising spend (ROAS). It also lowers customer acquisition costs since you’re getting more value out of the same amount of traffic.
Better conversion rates lead to faster product turnover, improving inventory management and cash flow. They also enable more accurate demand forecasting, helping you make smarter purchasing decisions. Even small improvements in this metric can give your business a stronger edge in the marketplace.
Ease of Tracking and Analysis
Tracking conversion rates is straightforward with most analytics tools. Platforms like Google Analytics allow you to define conversion goals and analyze performance by demographics, behavior, and technology. These tools also offer various attribution models to help pinpoint optimization opportunities.
E-commerce platforms such as Shopify and WooCommerce come equipped with built-in conversion tracking, real-time reporting, and cohort analysis. Setting up multiple goals - like final purchases or smaller actions such as email sign-ups or add-to-cart clicks - provides deeper insights into the customer journey. Additional tools, like heatmaps and session recording software, can reveal friction points and user behavior patterns, helping you address issues when conversion rates dip. This layered approach ensures you have the data needed to fine-tune your strategy and improve performance.
sbb-itb-0bd1697
7. Conversion Rate by Channel
Following the earlier discussion on funnel metrics, understanding conversion rates by channel helps pinpoint where your best traffic turns into sales. This metric measures the percentage of visitors from various sources - like organic search, paid ads, social media, and email - who complete a purchase. With this data, you can focus your efforts on the channels that deliver the most value.
Funnel Stage Relevance
Different channels play distinct roles in the customer journey. Organic search often attracts visitors with high purchase intent. Paid search tends to target users who are ready to buy. Social media, on the other hand, is great for building awareness but usually requires follow-up engagement to convert. Email campaigns excel at converting returning customers, while display ads are effective for boosting visibility and retargeting.
Actionable Insights Provided
Breaking down conversion rates by channel offers clear guidance for refining your strategy. For instance, if your search campaigns consistently outperform social media campaigns, it might make sense to allocate more budget toward search while rethinking your social media tactics. Similarly, if mobile conversions lag behind desktop, it’s a sign to improve your mobile shopping experience.
Impact on E-Commerce Performance
Leveraging these insights can significantly improve metrics like your return on ad spend (ROAS) and customer acquisition costs (CAC). Understanding that each channel has its strengths - some driving quick sales while others require nurturing - enables you to set realistic goals and create more effective marketing sequences.
Ease of Tracking and Analysis
Tools like Google Analytics automatically break down conversion data by source, while platforms such as Shopify provide built-in reporting for different channels. Unified dashboards, like those offered by Feedcast.ai, combine data from sources like Google, Meta, and Microsoft Ads, making it easier to compare performance and fine-tune campaigns. Additionally, using UTM parameters ensures accurate tracking and attribution for all your marketing efforts.
8. Average Order Value
Average Order Value (AOV) tracks the average dollar amount customers spend per transaction. It’s a key metric for understanding how effectively your content encourages customers to purchase more items or opt for higher-priced products, ultimately increasing revenue without the need for additional customer acquisition.
Funnel Stage Relevance
AOV plays a crucial role during the consideration and purchase stages of the e-commerce funnel. At these points, customers are already leaning toward making a purchase, and your content can nudge them toward spending more. For example, detailed product descriptions, cross-selling recommendations, and bundle deals can motivate customers to add complementary items or select premium options. Similarly, checkout-stage content - like free shipping thresholds, last-minute add-ons, or time-sensitive offers - can naturally increase cart totals. These strategies not only enhance customer intent but also provide actionable insights for fine-tuning your content approach.
Actionable Insights Provided
Breaking down AOV by content type can shed light on what drives higher-value purchases. For instance, product comparison guides or in-depth video demos often highlight premium options that lead to increased spending. Additionally, analyzing AOV across different traffic sources can uncover patterns in customer behavior, helping you adjust your content strategy and allocate marketing budgets more effectively.
Impact on E-Commerce Performance
Even small increases in AOV can significantly improve revenue and profitability per customer, all without additional acquisition costs. These gains can also create a better balance between marketing expenses and revenue, freeing up resources to invest in growth opportunities.
Ease of Tracking and Analysis
Tracking AOV is straightforward. Most e-commerce platforms automatically calculate it by dividing total revenue by the number of orders. Tools like Feedcast.ai take it a step further, offering unified dashboards that combine AOV data with ad performance metrics across platforms like Google, Meta, and Microsoft Ads. This integration helps you make smarter decisions about budget allocation and content optimization.
9. Leads Generated
After diving into direct sales metrics, it's time to focus on lead generation - an early signal of potential long-term customer relationships.
Leads Generated measures the number of users who share their contact information, indicating interest that goes beyond making a quick purchase. This metric is especially valuable when selling higher-priced products, as it helps nurture prospects and build customer loyalty over time.
Funnel Stage Relevance
Lead generation plays a key role in the awareness and consideration stages of the e-commerce funnel. At the awareness stage, visitors might exchange their email addresses for buying guides, product catalogs, or industry reports. During the consideration stage, they may sign up for product demos, size guides, or exclusive discount alerts. For example, a well-designed guide or checklist can effectively capture the attention of those who are interested but not quite ready to buy.
Actionable Insights Provided
By tracking leads based on content type, you can pinpoint what resonates most with your audience. Educational materials, like how-to guides and tutorials, often perform better at attracting engaged leads than purely promotional content. Analyzing which resources convert subscribers into paying customers helps you refine your lead magnets and focus on formats that drive results.
Impact on E-Commerce Performance
Strong lead generation creates a steady pipeline for future sales, reducing the pressure for immediate conversions. Email subscribers tend to have higher lifetime value, thanks to targeted campaigns and special offers that keep them engaged. Plus, building an email list gives you a direct line to your audience - one that doesn’t depend on social media algorithms or paid ads. This control over communication can be a game-changer for cultivating customer relationships.
Ease of Tracking and Analysis
Most email marketing platforms make it simple to track lead generation metrics. You can monitor performance by setting up conversion tracking for blog posts, landing pages, or downloadable resources. Tools like Feedcast.ai even connect lead generation data with advertising performance across platforms like Google, Meta, and Microsoft Ads, helping you identify which campaigns bring in the most valuable subscribers and optimize your ad spend.
10. Customer Lifetime Value
Customer Lifetime Value (CLV) measures the total revenue a customer is expected to generate throughout their relationship with your brand. It offers a broader view than just individual transactions, helping you understand the long-term impact of your content and customer acquisition strategies.
CLV provides insights into which types of content attract customers who not only stay loyal but also spend more over time. For example, a customer who first engages with an educational blog post might initially spend less than someone who converts via a targeted ad. However, over time, the blog-driven customer could contribute more revenue by becoming a repeat buyer.
Funnel Stage Relevance
CLV spans every stage of the customer journey - from awareness to retention - highlighting how content like blog posts, buying guides, and how-to videos can build loyalty, even if they don’t lead to immediate sales. Unlike metrics that focus on a single stage of the funnel, CLV extends into retention and advocacy, areas often overlooked in traditional models. Content that educates and builds trust, such as product guides, styling tips, or maintenance instructions, often nurtures stronger, long-term relationships compared to content designed solely for quick conversions.
This long-term perspective ensures your content investments are aligned with sustainable growth.
Actionable Insights Provided
CLV data can refine your content strategy and budget allocation. By analyzing CLV by content source, you can identify which formats drive the most value over time. For instance, customers who engage with video tutorials might have a higher lifetime value, signaling that resources should be directed toward producing more of this content.
It also informs your spending on customer acquisition. If customers brought in through educational content consistently show high lifetime value, it justifies investing more in high-quality guides and tutorials. The long-term returns often outweigh the initial costs, making it a smart investment.
Impact on E-Commerce Performance
Focusing on CLV shifts your approach to content performance and marketing spend. Instead of prioritizing immediate returns, you can develop content strategies that emphasize building lasting customer relationships. This approach often results in sustainable growth and healthier profit margins.
High-CLV customers frequently become brand advocates, sharing your content and recommending your products to others. This creates a ripple effect, driving organic growth and reducing your dependency on paid advertising over time.
Ease of Tracking and Analysis
Tracking CLV accurately requires integrating customer data with content performance metrics. It involves connecting data across various touchpoints and time periods. While many e-commerce platforms offer basic CLV calculations, gaining deeper insights into content performance often requires more advanced tracking methods. By linking first-touch attribution data with long-term purchasing behavior, you can pinpoint which content types generate the most valuable customers.
Tools like Feedcast.ai can simplify this process by combining your content and advertising data from platforms like Google, Meta, and Microsoft Ads. This unified view makes it easier to assess how different content and advertising channels contribute to long-term customer value.
Metric Comparison Table
This table connects each metric to its funnel stage, the insights it provides, its influence on performance, and the complexity of tracking it. It serves as a summary of the metrics discussed earlier, laying the groundwork for refining how content performance is measured.
| Metric | Primary Funnel Stage | Key Insight | Impact on Performance | Tracking Difficulty |
|---|---|---|---|---|
| Website Traffic | Awareness | Shows how many potential customers enter your funnel | Forms the base for all other metrics - more traffic means more opportunities | Easy |
| Bounce Rate | Awareness/Interest | Reflects content relevance and quality of initial engagement | High bounce rates suggest misaligned content or poor user experience | Easy |
| Product Page Views | Interest/Consideration | Indicates product interest and content effectiveness | Highlights which products are drawing attention | Easy |
| Add-to-Cart Rate | Consideration/Intent | Tracks purchase intent and product appeal | Measures how well browsers are turning into potential buyers | Moderate |
| Checkout Abandonment Rate | Intent/Purchase | Identifies friction points in the buying process | Pinpoints barriers stopping transactions from being completed | Moderate |
| Conversion Rate | Purchase | Evaluates overall funnel performance | Key indicator of how effectively visitors are turned into customers | Easy |
| Conversion Rate by Channel | Purchase | Assesses performance of specific traffic sources | Identifies which channels bring in the highest-quality prospects | Moderate |
| Average Order Value | Purchase | Tracks revenue per transaction | Reflects success in upselling and customer spending habits | Easy |
| Leads Generated | Interest/Consideration | Measures potential for future sales | Shows how well you're capturing prospects for nurturing | Moderate |
| Customer Lifetime Value | All Stages + Retention | Evaluates long-term customer value | Shifts focus from immediate gains to sustainable profit | Difficult |
Key Insights from the Metrics
Tracking difficulty reflects how complex it is to set up analytics, ranging from basic configurations to advanced attribution models.
Funnel stage relationships illustrate how these metrics interact. For example:
- Awareness metrics like website traffic and bounce rate measure how well you attract initial interest.
- Interest and consideration metrics - including product page views, add-to-cart rate, and leads generated - show how effectively prospects are nurtured through the middle stages.
- Purchase-focused metrics like conversion rates and average order value reveal how well you close sales.
- Customer Lifetime Value (CLV) spans all funnel stages and extends into retention and advocacy, offering a broader perspective on long-term customer relationships.
Prioritizing Metrics for Your Goals
To make the most of this data, focus on metrics that align with your business objectives:
- If your goal is immediate revenue, prioritize metrics like conversion rate and average order value.
- If you're aiming for long-term growth, focus on customer lifetime value and leads generated.
The most successful e-commerce businesses track all ten metrics but concentrate their optimization efforts on three to five that align with their growth stage and goals. This approach avoids overwhelming amounts of data while ensuring you're focusing on what matters most.
Finally, tools like Feedcast.ai make it easier to track performance across platforms like Google, Meta, and Microsoft Ads, streamlining cross-channel analytics and helping you stay on top of what drives success.
Conclusion
Tracking these ten metrics together gives you a complete view of your funnel. For example, if you see a high bounce rate with low product views, it likely points to irrelevant content. On the other hand, strong add-to-cart rates combined with high checkout abandonment might suggest trust issues or technical problems.
The secret to improving your funnel lies in consistent tracking and prioritization. Instead of trying to optimize everything at once, focus on three to five metrics that align with your business goals. For instance, startups might concentrate on website traffic and conversion rates, while more established businesses often gain more by focusing on average order value or customer lifetime value.
Also, think about how customers engage with your brand across multiple platforms. Cross-channel tracking is crucial because today’s customers often move between channels before making a purchase. Someone might see your product through a Google ad, check reviews on social media, and then complete their purchase through an email offer days later. To understand these journeys, you need unified analytics that connect the dots across all channels.
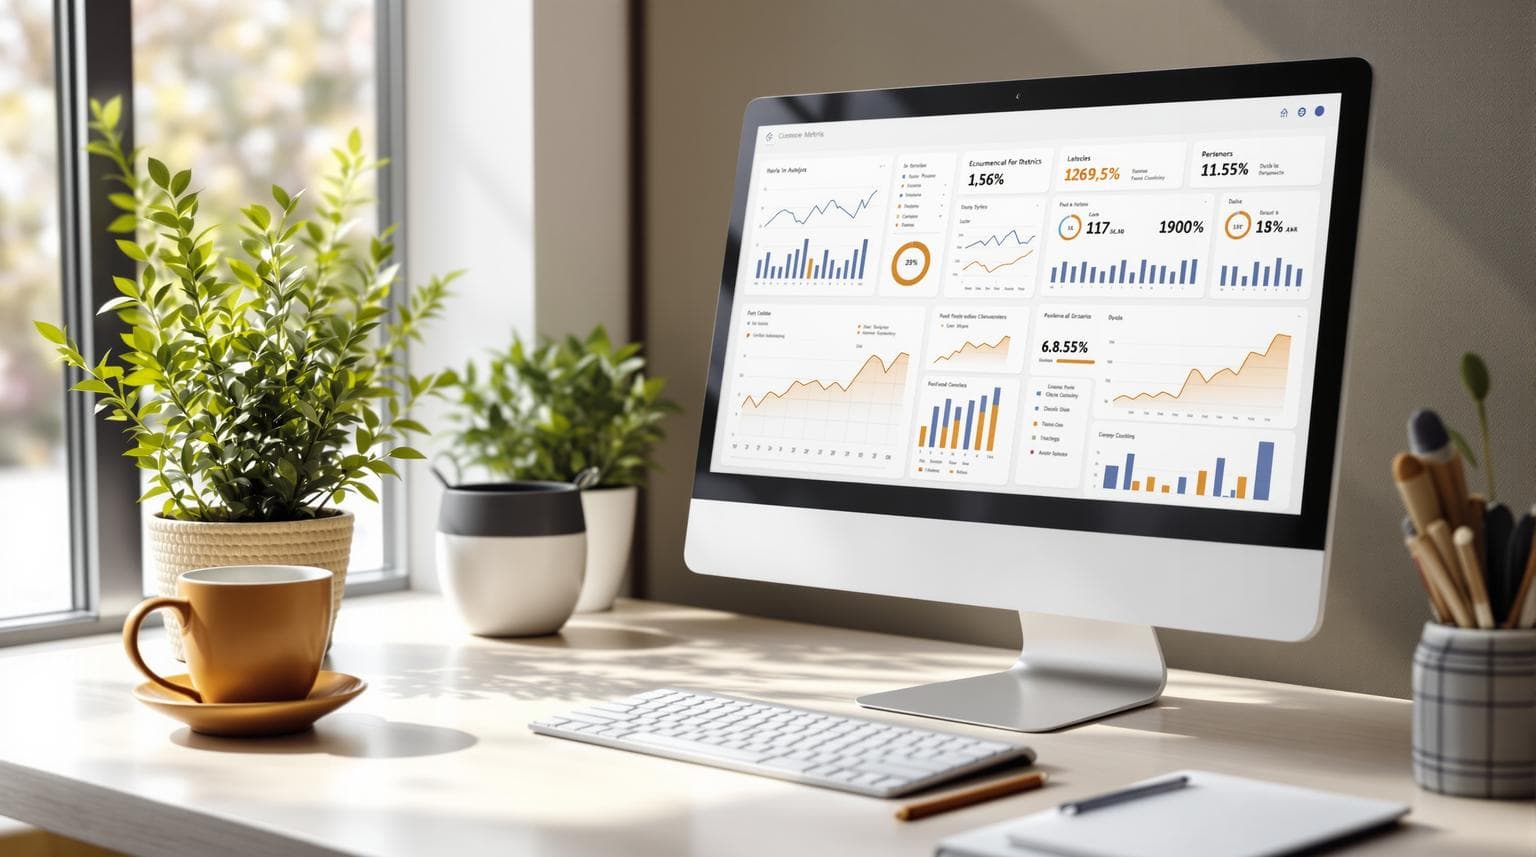
To tackle these challenges, tools like Feedcast.ai make tracking easier. With a centralized dashboard, it brings together performance data from Google, Meta, and Microsoft Ads. Its AI-powered insights help identify the best traffic sources and content types, while automated reporting lets you focus on optimization rather than just collecting data.
FAQs
What are the best content metrics to focus on for improving my e-commerce funnel?
To make your e-commerce funnel more effective, focus on metrics that directly impact conversions and customer engagement. Start with the conversion rate, average order value (AOV), and customer lifetime value (CLV) - these are the numbers that directly shape your revenue and growth trajectory.
It's also important to keep an eye on your bounce rate and other engagement metrics. These can reveal how well your content connects with visitors and whether adjustments are needed to better match customer behavior. By concentrating on these key metrics, you can fine-tune your strategy to achieve results that truly matter for your business.
What causes shoppers to abandon their carts during checkout, and how can I reduce this?
Shoppers frequently abandon their carts for a variety of reasons - unexpected costs like shipping or taxes, a confusing checkout process, sluggish website performance, or worries about payment security. These hurdles can leave customers feeling frustrated and result in a significant number of incomplete purchases.
To tackle this, focus on simplifying the checkout experience. Be upfront about all costs from the start, ensure your website loads quickly, and provide secure payment options that build trust. You can also re-engage customers by sending follow-up reminders or offering discounts to encourage them to return and finalize their purchase.
Why is tracking Customer Lifetime Value (CLV) important for e-commerce businesses?
Tracking Customer Lifetime Value (CLV) is essential for e-commerce businesses. It reveals how much revenue a customer is expected to bring in throughout their relationship with your brand. With this knowledge, businesses can make better decisions about where to invest resources, focus on retaining customers, and strengthen long-term loyalty.
Knowing your CLV helps fine-tune marketing budgets, create personalized experiences, and identify your most valuable customers. In the end, boosting CLV translates into increased profits, smarter resource use, and steady business growth.
Yohann B.