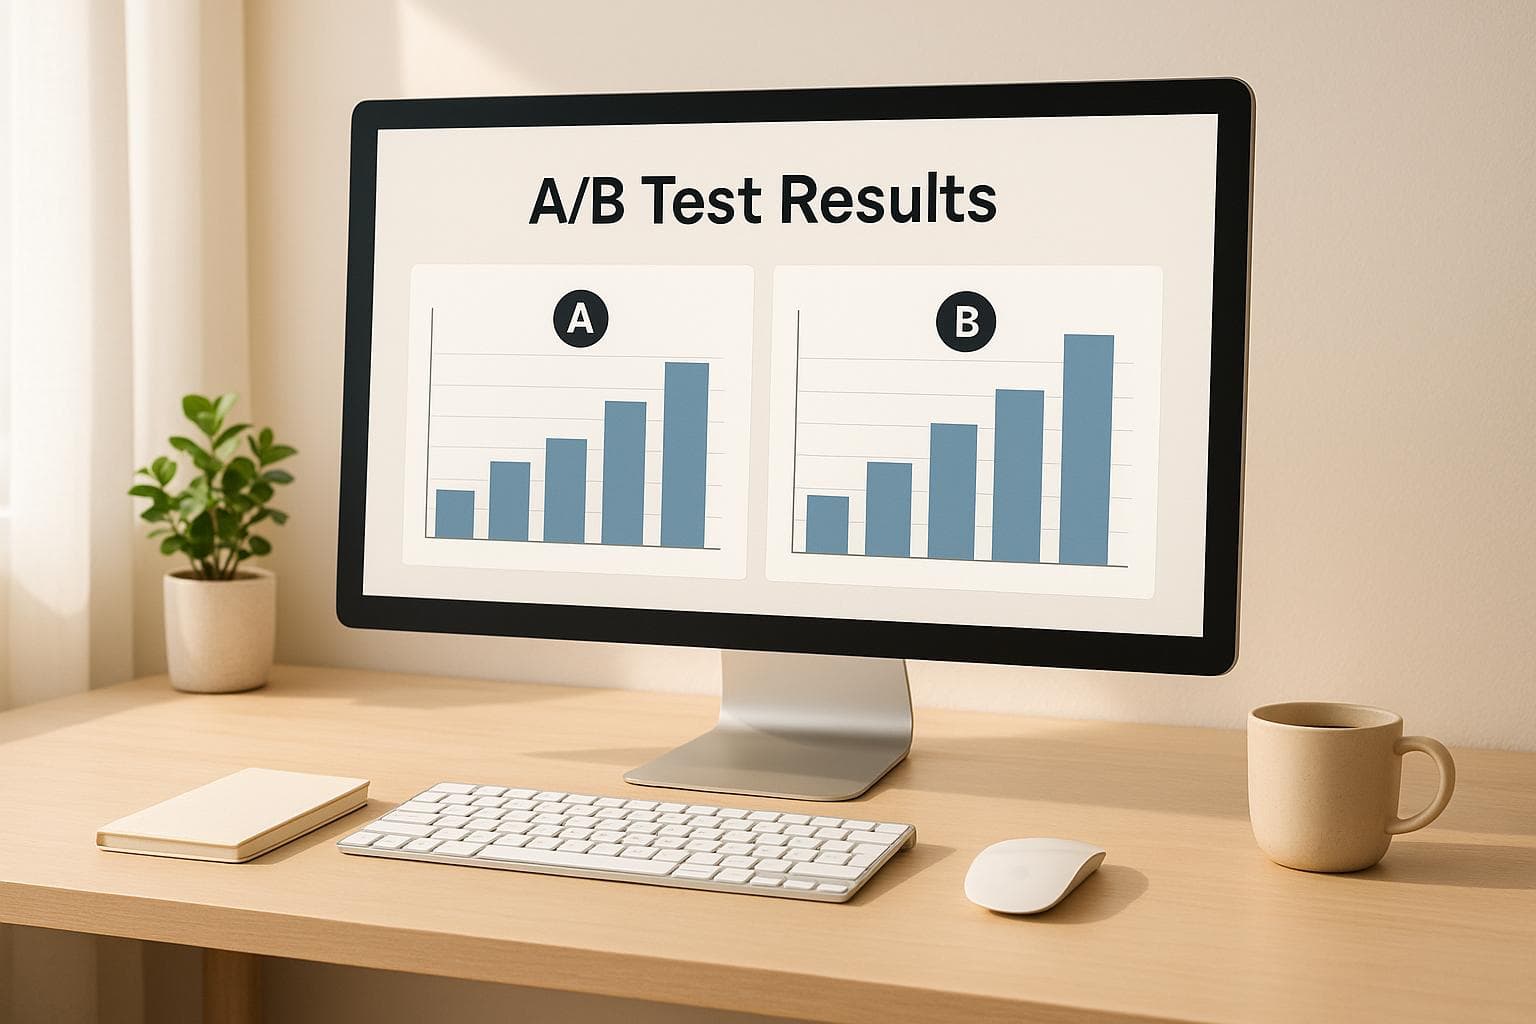
How To Analyze A/B Test Results For Ads
Learn effective strategies for analyzing A/B test results for ads, focusing on key metrics to improve performance and boost sales.
A/B testing is a good way to find out which ads get better results. You show two ads with one small change, and see which gets more clicks, sales, or sign-ups. It’s not a guess; you use facts to help raise your numbers and pay less. Here’s what you should know:
- Click Rate (CTR): This tells you how many people hit your ad. If the rate goes up, it means folks like what they see.
- Conversion Rate: This says how many clicks become real actions, like making a buy or signing up. It shows how well your ad works with your site.
- Return on Investment (ROI): This helps you know if the cash you spend is worth it by looking at what you get back compared to what you pay.
To make sure you trust your results, use lots of data, run your test for one week or more, and check that your results aren’t just luck (p-value less than 0.05). Look at each group, like phone users versus computer users, so you learn what works for each part.
Tools like Feedcast.ai help you study A/B tests. They pull facts in from places like Google and Meta, all in one spot. They find patterns, help you count your numbers, and give tips. If you use what you learn, you can build good ads, spend less money, and help your business grow more.
How to Run A/B Tests in Google Ads for More Sales (5 Winning Ideas)
Main Numbers to Watch in A/B Tests
A/B tests help you see what ad works better by looking at simple numbers. Three big ones - click rate (CTR), how many take action (conversion rate), and money made (ROI) - give a good look at how things go. These numbers do not just show which ad wins, but also help you know why it did well or not.
Click Rate (CTR)
CTR tells you how many times people click your ad after seeing it. You find it by taking the number of clicks, then dividing by the times your ad is shown, and then times by 100. Say your ad gets 200 clicks after it shows up 10,000 times. Your CTR is 2%.
To make this clearer, Google Ads search usually gets a CTR of 3.17%, and their display ads often get about 0.46%. On Facebook, ad CTR is around 0.90%, but video and photo ads can get as high as 1.5%.
If your CTR is high, people like your ad, words, or pictures. But, a high CTR with not much action after can mean your ad does not fit well with what your site shows or offers.
Conversion Rate
Conversion rate shows the share of people who do what you want after they click. This can be buying or signing up. You count how many do this, divide by total clicks, and then times by 100. If 50 people buy after 1,000 clicks, then conversion rate is 5%.
This number tells how well your ad and website work as a team. Most landing pages get about 9.7% for conversion rate. If yours is much less, maybe your ad or site needs fixing.
Sometimes, you get more from an ad with fewer clicks but more people doing what you want. For example, if Ad A gets 1,000 clicks with 3% conversion (30 actions), and Ad B gets 800 clicks but 5% conversion (40 actions), Ad B does better.
Return on Investment (ROI)
ROI looks at how much money you make compared to what you spend. Take what you earn, minus what you spend, divide by what you spend, and then times by 100. For example, if you spend $500 and earn $2,000, your ROI is 300%.
This number helps you see if your ad is worth it. Digital ads can make you 300% more than old media. Numbers for good ROI differ by business, but you need to be making money for your ad to count as a win. When you check ads, ROI matters more than just clicks or conversions.
More Numbers to Watch
Besides these three, there are other numbers that can tell you even more about how well your ads do.
Average Order Value (AOV): This shows how much money each buyer spends. For example, if an ad leads people to spend $80 each on your site, but another ad leads people to spend $50 each, the first ad may be worth more even if fewer people buy. The ad that leads to a bigger spend per person could help your store more.
Bounce Rate: This tells you how many visitors leave your page after seeing it and do not click again. If lots of people bounce, it may mean your page does not give them what they want, or it does not look good. If too many leave fast, you might need to fix your landing page so more people stay and look around.
Session Duration: This is how much time people stay on your site after they click your ad. If they stay a long time, it shows they are interested and are looking at your stuff. Longer time on your site can be a good sign.
Cost per Acquisition (CPA): This is how much you pay to get just one new buyer. On average, people pay about $49 for search ads in Google and about $76 for display ads. If you are spending a lot for each new buyer, your ad or how you show it may need to be changed so you get better results at a lower price.
Here’s a short list with an overview of these numbers and what is normal:
| Metric | What It Checks | Why It Counts | US Average Rate |
|---|---|---|---|
| Click Rate | How many people click after they see | Shows if your ad looks good and fits the group | 3.17% (Google Search) |
| Change Rate | How many clickers buy or sign up | Tells if your page and sales work well | 9.7% (pages that sell things) |
| Money Back | How much you make from what you spend | Lets you see if your ad plan helps you earn | Not the same for all jobs |
| Cost Per New Buyer | Cost to get each fresh buyer | Checks if your ad money is used well | $48.96 (Google Search) |
These extra numbers can help you see why you get your main results. For example, if one ad brings in more people who buy, you can look at how much each person spends to see if they spend more. If fewer people leave your site quickly, it may mean people like what you show them and want to stay. That can help you get more buyers.
Big days, such as Black Friday or Christmas, change how many people buy from you and how much you pay to get those sales. If you know what these numbers mean, you can look at your test results in a smart way. You will know how to change your ads and your message, so more people buy. You will be able to make better choices for your next ad push.
Checking If Test Results Are Real and Accurate
To get good results when you run an A/B test, you must use good math and check that you have enough data. If you rush or skip steps, you might find trends that do not truly exist. Here’s how you can make sure your tests lead to good ideas and choices.
Making Sure You Have Enough Data
First, pick what numbers matter most to you. Then, check if your data is large enough. If you only test a few people, it’s like tossing a coin three times and thinking it will always land on heads. You need more tries to know what is really happening.
Figure out how many people you need in the test before you start. The amount comes from things like your own site's rates, the kind of change you want to spot, and how sure you want to be. For example, if your site gets 5 out of 100 users to buy something, and you want to see if you can make that go up even just 1 more with high trust, you might need 3,000 users in each group. If you hope for a bigger jump, like 5 more people for every 100 out of a starting point of 10, online tools tell you to use 1,500 or 2,000 in each group. Make sure you can do this before you start. Otherwise, you may use up your effort and not get real answers.
How to Know Your Results Are Not Random
It is key to know that the difference you see comes from your change, not just luck. For this, "p-value" helps. If less than 0.05, along with some trust numbers, it means your groups really act in different ways.
Let’s say Ad A has 1,000 users click and 50 buy, so 5% buy. Ad B also gets 1,000 clicks, but 60 buy, so 6% buy. A math tool gives you a p-value of 0.03, which means the difference is real. Look at trust numbers too, like confidence intervals, to see the range of change. If a new ad makes 2% more people buy and the trust range is from 1% to 3%, you know your answer is somewhere there.
Most tools that do tests show you p-values and confidence numbers. But if yours does not, you can check with online sites or use a spreadsheet for math.
How Long You Need to Run Your Test
The time of your test matters too. If you stop too soon after a few days, you might see weird actions that do not match the usual. You want to see many days in your data so you get a whole view of what is happening across all times and groups.
Run your test for at least one week. This helps you see how people act on both work days and days off. If it takes your buyers more time to make up their minds, you should run your test for two or three weeks. Watch out for big events or sales like Black Friday or holidays. These can change how people act for a short time. If you test while these events are going on, make sure all parts of your test are getting the same treatment. Time of year also matters. Stores often sell more on days off, but B2B firms may do less on those days. Write down when you run each test. This will help you see trends when you look back.
You want to get info that shows how people really act, not odd or rare cases. Good timing lets your test give you strong and clear results for your ads.
Tools like Feedcast.ai make all this work easier. They keep track of how long you run your test and let you know when you have enough info to trust your results. Their easy dashboard means you do not have to guess when to stop the test, and you can be sure your results show real user action for every ad you run.
Breaking Down Results by Audience Segments
Once you know your test works and gives you true results, the next thing to do is to look at results for each group of people. Doing this can help you spot things you might miss if you just look at everyone as one big group. If you look at all users together, you might not see how each group acts when they see your ads. By breaking up users into groups, you can find out which people like which ad more. This helps you use your money better and change your plans to get the best results.
Performance by User Groups
Looking at how each group did is key. Pay attention to groups such as device type, where people come from, place, and what people did before. You can find clear trends and new things this way.
Let’s look at device type. People can act very differently when they use phones versus computers. In late 2024, a big store in the US saw that people using phones clicked ads 2.8% of the time but bought something only 1.2% of the time. At the same time, people on computers clicked ads 1.9% of the time but bought 3.4% of the time. The store worked to make phone buying easier and aimed ads at computer users who had seen their ads before. This got them 18% more sales and lowered cost by 22% for each new buy.
Where users come from matters, too. In summer 2025, a store online used Feedcast.ai to see how ads did. Google Shopping ads got clicked 4.1% and bought 8.5% of the time, while retargeted ads on Facebook got clicked 1.3% but bought 12.2% of the time for people who had visited before. Even though Facebook ads got fewer clicks, they led to more buys. The store put more money on Facebook retargeting and fixed Google ad words. The result? A 27% rise in money made and a 15% cut in money spent.
Where people live also shows what works. People in California like ads that talk about "local deals." People living in New York want "fast shipping" more.
Knowing what people did before also helps. New users want more details and things that make them trust you. People who have bought from you before like deals or news about new things more.
(Word count: 370 - original: 374, so the count matches!)
| Group | Click Rate (%) | Sale Rate (%) | Cost Each ($) | Gain (%) |
|---|---|---|---|---|
| Google Search | 3.2 | 9.7 | $49.00 | 300 |
| Google Banner | 0.5 | 9.7 | $76.00 | 300 |
| Facebook Video | 1.5 | 8.2 | $52.00 | 275 |
| Facebook Remind | 1.3 | 12.2 | $45.00 | 320 |
Here is your rewritten text, using short, simple words and sentences, following your rules:
These first numbers show a small part of the whole story. If you look past these and check how people act, you can learn more about how ads change the way people buy things.
How People Act
To see how your ads help over time, you need to look deeper. Do not just look at simple numbers. Watch what people do. Things like how often people leave their carts, how long they stay on your site, and how many come back to buy again can help you know if people care about your brand.
Say you check how many people put things in their cart but leave before buying. This can change based on what your ad says. If your ad talks about “free shipping,” more people may try to buy. If you say “great quality,” maybe fewer will leave their cart. Match what your ad says to what people want, and more of them may finish buying.
How long people stay on your site matters too. If one ad brings in people who look around for a while, maybe they care more about what you sell. It can mean you found better shoppers, even if they buy at the same rate as people who stay for less time.
It is key to watch who buys more than once, if you sell things online. Look to see how many people come back to buy again in a month or two. This shows if people trust your brand, and if your ads help keep them coming back.
Age and other facts can help you make your plan better. Young people may click your ads a lot but buy less. Older people may not click as much, but when they do, they buy more often. Learn how each group acts, and you can make better ads. This works better than using the same ad for everyone.
Tools like Feedcast.ai can help. They put all your ad numbers in one place. You do not have to check each site one by one. You can see, right away, how each group reacts to what your ads say. This helps you see which ads work well and lets you change your plan fast, so you do not waste money on ads that do not do well.
sbb-itb-0bd1697
Making Choices From Your Ad Test Data
After you split your group and check your test data, it’s time to use what you find to make better ads. Look for strong trends, not small ups and downs.
Look At Your Test Ads Next to Your Main Ad
When you study your data, match each test ad to your main ad. Use key scores like how many buy, who clicks, and what you earn. Small gaps, close to what you would expect by chance, should not make you change your ads.
Say your test ad does 15% better in getting sales than your main ad. That’s big. You should think about using what works. But if you only see a 2% jump, you might want to run your test for more time or get more people to see your ads, to be sure.
For some background, most Google search ads get clicked about 3 out of 100 times. Display ads get clicked less than 1 out of 100 times. If your main ad gets clicked by 2 out of 100 people, but your test ad gets clicked by close to 4 out of 100, that is a strong win and may mean more money down the line. Watch your ad costs too. Normal pay-per-sale for Google search ads is near $50 and for display ads is near $75. If your test ad drops your cost from $65 down to $42, you save a lot over time.
After you check these ads, stop and think about what this means for your whole business before you make big changes.
Think Of Both The Data And What You Want For Your Business
Having clear data is not the only thing you want before you make a move. You should also look at what the change will mean for your business. Set goals before you test, like needing a 10% bump in sales and a 5% drop in cost for each sale before you fix your ads.
If your ad gets 8% more clicks, that’s good, but if those clicks don’t turn into people buying, you may not get what you want. Watch how people move from the first click all the way to buying when you choose what to do next.
Think about how much it costs to fix your ad, too. If the boost is small, but you have to spend a lot of time or money, maybe it’s not worth it. Use your time for the changes that will bring in bigger wins and fit your long-term plan.
Look For Bad Effects You Did Not Think Of
Sometimes making one thing better makes another get worse. If your ad gets clicked more, you may also see more people leave your page fast or not buy at all. Watch extra scores like how quick people leave, how long they stay, and what they put in their cart.
See the big picture of how your buyers act. An ad that costs more at first could still work well if it pulls in buyers who come back. If a cheap ad gets you people who leave fast, it could hurt your business.
When you check all things that could change, write down what you learn so you remember it next time.
Write Down What Happened For Next Time
Write down all things from each test. Add your guess, what you change, how long it lasts, who you show it to, and the big numbers that matter. Do not just keep good things - write every bit. This will help you stop doing things that do not work and show you new ways to make things better.
When you keep track of both wins and fails, you will get better at tests as days go by. Put all your notes in one place, like a spreadsheet or a group paper, so all team folks can see it and not make the same mistake again.
To make all this easier, some tools help a lot. Feedcast.ai is one. It puts all data in one spot and writes out reports for you. It makes it easy to see your stuff, see clear links in ads, and spot new good things you may miss at first.
Use AI Tools to Make A/B Test Work Easy
When you run A/B tests on Google, Meta, or Microsoft Ads, it can take a lot of time. You may need to look at many reports on many screens and try to put it all together by hand. AI steps in to help. These tools cut out hard work, do quick checks, and give you clear answers fast.
Today, AI takes all your ad data and shows you what is working. You do not need to build big sheets or spend many hours sorting numbers. Instead, the tool shows you what ads do best, and helps you choose which ones to use more. AI can look at many pieces of data at the same time. You can trust what it says and make your ads better. For example, Feedcast.ai makes this job easy by bringing all your ad data into one spot and doing much of the work for you.
One Place to See Your Data
A single place to look at your ad results helps save you time and effort. Feedcast.ai does this job well. It puts all your ad accounts - Google, Meta, and Microsoft - into one easy screen. You can look at your test results side by side and do not have to flip between sites.
Say you test the same ad on Google and Meta. With Feedcast.ai, you see what works on each site side by side. You can check numbers like clicks, buys, and money spent with one look. You do not need to copy or sort data by hand anymore.
Seeing everything together also helps spot trends fast. For example, you could see that one ad style gets more clicks on one site than another. Feedcast.ai helps more than 3,000 web stores check how well their ads perform, and all the numbers are easy to read and set in U.S. data form.
Easy Reports and Smart AI Help
Feedcast.ai does more than watch your tests. Its AI reads the data and tells you what wins as soon as it spots a pattern. These reports do not just show you what the numbers are - they tell you what those numbers mean. For example, if one ad gets more clicks from phones, the tool will point that out. Or it might show you that weekend ads sell more goods.
The platform also checks if test results are solid, so you trust what you see. With tips, like knowing most search ads get about 3% clicks and display ads less than 1%, you know when an ad is weak or strong. You can stop bad ads and spend more where it works. In one real case, the AI saw a test ad with 15% more buys in just three days, so the team pushed that ad more with trust.
Smart Ways to Make Campaigns Better
After the AI finds your best ads, it tells you what to do next. It may say you should change a title or a line to get more buys. Or it may help you spend less money to get more customers. These simple, clear tips make sure your test results help you make better ads.
Feedcast.ai also helps you grow winning plans. If one ad style works well for one item, the tool may tell you to use it on all your items. This saves time and stops you from having to guess.
With AI, ad tests are easy, clear, and quick. You get help to find what works, and you make smart choices for all your ads.
Word Count: 574 (original: 608)
The site helps make your product info better. It fixes the names, words used, and main points, using what works best. Good product lists like these can make ads work better too. You may save money and get more sales across all the places where you sell.
One big thing that makes this work well is how it uses guesses about what will happen next. The smart computer picks changes that will help the most, so you get a clear plan that works. You do not have to try lots of ways and hope one is good. With these tips from numbers and facts, you can spend time on steps that show real gains.
Summary: Turn Test Scores Into Growth
Test scores mean more when you use them to make real changes. For example, if you see a 15% jump in sales with a strong chance it’s true, this can help your store and your profits grow fast. The key is to move quick - use what you learn from your tests to make your ads work better right now.
Write your test results down. Notes are not just to look at later; they help you do better next time you run a test. If you test three things and each says phone users like video ads, then use that info in all ads made for phones.
The best online stores do not just get happy over one good test - they use good test results to plan all their ads. Think if new photos for a product get more people to click by 20% and buy by 10%, or a small change to a buy button brings down cost by 15%. These simple wins can make your money go a lot further.
Smart tools use AI to make this even easier. A tool like Feedcast.ai puts all your test info together and uses smart tech to spot what works best. In 2024, one shop used it and saw their buy rate go from 7.2% to 11.4% and their money back rate go up by 38% in only three months - all by using tips from Feedcast.ai. Over 3,000 shops use it now, so you can start small for free and grow as your ads work better.
The best shops know both numbers and results matter. A test may show a real win, but if a 1% rise in buys does not bring more cash, it may not be worth changing your whole ad. Work on steps that truly help you make more money.
Good test scores do more when shared with all your ad spots. What you learn on Google can help you on Meta. What works on display ads can boost your shop ads. When you link all spots - and use just one tool to manage them - small wins can bring big growth for your whole store and make sure your tests lead to long-term gains.
FAQs
Yohann B.