Ultimate Guide to E-commerce KPI Dashboards
Explore how e-commerce KPI dashboards enhance decision-making by tracking key metrics in real-time, optimizing performance, and driving growth.
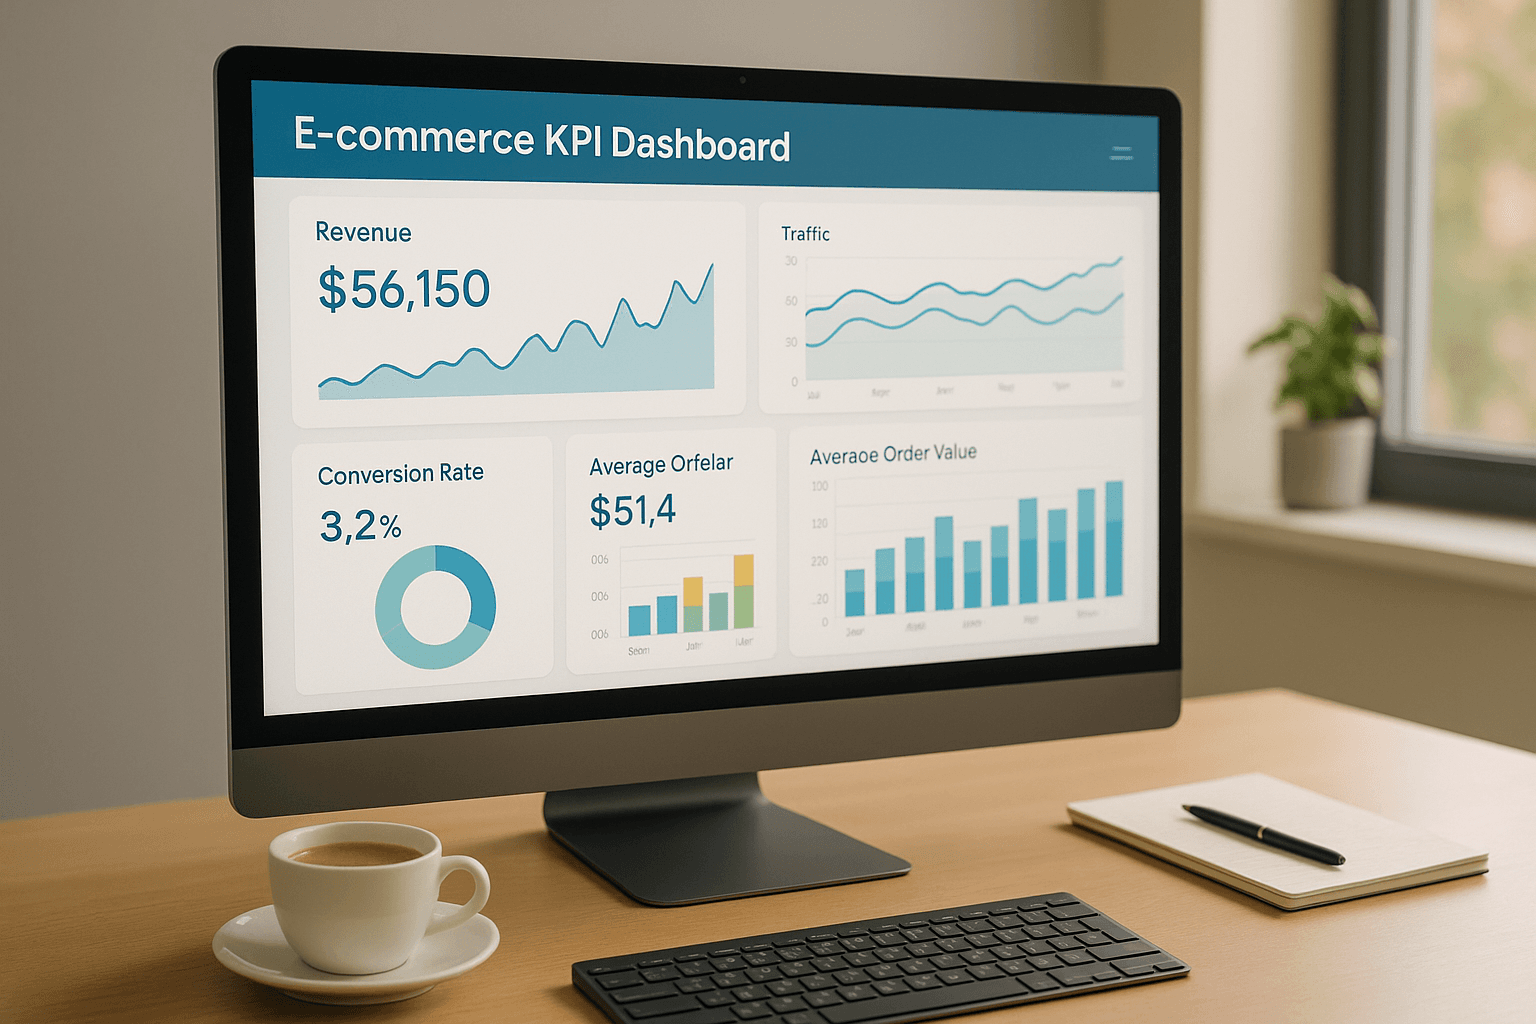
E-commerce KPI dashboards are tools that provide real-time insights into your business performance, helping you track sales, customer behavior, and operations all in one place. Unlike static reports, these dashboards allow you to monitor trends instantly and make quick adjustments to improve outcomes. Here's what you need to know:
- Why they matter: They help you identify trends, fix issues like cart abandonment, and improve decision-making.
- Key metrics to track: Sales (e.g., total sales, AOV, conversion rate), customer behavior (e.g., CAC, CLV, cart abandonment), and operations (e.g., fulfillment cost, inventory turnover).
- How to build one: Choose the right platform, align KPIs with goals, and design clear visualizations.
- Advanced features: Real-time data, predictive analytics, segmentation, and AI-powered automation.
Tools like Feedcast.ai simplify managing ad campaigns across platforms like Google and Meta while optimizing key metrics like ROAS and CAC. With dashboards, you can centralize data, act faster, and improve performance across your e-commerce operations.
Ecommerce Sales KPI Dashboard in Power BI | Best Practices
Important E-commerce KPIs to Monitor
Choosing the right KPIs for your e-commerce dashboard is a key part of shaping your business strategy. With the industry projected to grow at an annual rate of 8.22%, reaching US$1.84 trillion by 2029 [2], keeping an eye on the right metrics is critical to staying ahead of the competition. Prioritize KPIs that directly impact revenue and enhance customer experience.
Your dashboard should focus on three main KPI categories: sales and revenue metrics to track financial health, customer behavior metrics to understand how people interact with your store, and operational metrics to ensure your business runs smoothly. Let’s break down these three categories for a clearer view of what matters most.
Sales and Revenue Metrics
Total Sales and Gross Profit are the foundation of financial tracking. These numbers show how much revenue you’re generating and how much you’re retaining after covering costs. Keeping tabs on these metrics helps you identify trends early and make adjustments to pricing or promotions.
Average Order Value (AOV) reveals how much customers spend per transaction. This is crucial for planning inventory and understanding buying habits. For example, Pura Vida Bracelets increased their AOV by offering free shipping on orders over US$25 [4].
Conversion Rate measures the percentage of visitors who make a purchase. With the average e-commerce conversion rate hovering between 2–3%, a lower rate might indicate problems like poor website usability or a complicated checkout process [5].
Revenue Per Visitor (RPV) combines traffic and sales data to show how well you’re converting visitors into paying customers. If this metric starts to drop, it could be a sign to refine product recommendations or simplify the checkout experience.
Together, these metrics help you understand whether increased sales are coming from higher transaction volumes or larger purchases. For instance, if total sales are climbing but AOV is decreasing, it might mean you’re attracting more customers who are spending less per visit.
Customer Behavior Metrics
Customer Acquisition Cost (CAC) and Customer Lifetime Value (CLV) are essential for evaluating your marketing efficiency. A good rule of thumb is that CLV should be at least three times higher than CAC [1].
Cart Abandonment Rate highlights the percentage of shoppers leaving without completing their purchase. This can point to issues like unexpected shipping costs, a lengthy checkout process, or limited payment options. Simplifying checkout steps and being upfront about fees can help reduce this rate [5].
Customer Retention Rate measures how well you’re keeping existing customers, which is crucial since acquiring a new customer can cost five to twenty-five times more than retaining one [6]. Regularly tracking this metric can help you spot patterns in customer loyalty.
Major players like Amazon use AI-driven recommendations to personalize shopping experiences, reportedly generating up to 35% of their revenue this way [3]. This shows how understanding customer behavior can directly boost sales.
Return Rate sheds light on product quality and customer satisfaction. The average e-commerce return rate is around 30% [5], but this can vary depending on the product category. High return rates might point to issues like misleading product descriptions or quality concerns.
By analyzing these behavioral trends, you can fine-tune your marketing strategies and improve the shopping experience. For example, if mobile users are abandoning their carts frequently, it might be time to optimize your mobile checkout process.
Operations and Efficiency Metrics
Operational efficiency is just as important as sales and customer insights. Fulfillment Cost tracks what you spend on warehousing, packaging, and shipping. Monitoring this metric can help you negotiate better shipping rates and streamline operations.
Order Processing Time measures how quickly you handle orders from placement to shipment. Faster processing not only improves customer satisfaction but also gives you a competitive edge as your business scales.
Inventory Turnover Rate shows how fast you’re selling through your stock. A low turnover might mean you’re overstocking slow-moving items, while a high turnover could indicate frequent stockouts and missed sales opportunities. This metric is key for managing cash flow and making smarter purchasing decisions.
Customer Service Response Time plays a big role in customer satisfaction and loyalty. Faster response and resolution times - whether through extended support hours or chatbots - can make a big difference [3].
Lastly, page load times are a critical part of operational efficiency. Slow-loading pages can hurt conversion rates, so optimizing your site speed with tools like browser caching and image compression is essential [5].
How to Build and Improve Your E-commerce KPI Dashboard
Creating an effective KPI dashboard means turning raw data into actionable insights without unnecessary complexity. Think of it as your control center, designed to help you make quick, confident decisions.
Choosing the Right Platform and Tools
The backbone of a reliable KPI dashboard is the platform you choose. Instead of chasing flashy features, focus on one that integrates seamlessly with your current e-commerce tools. This ensures smooth data flow and eliminates the hassle of manual input or errors.
Your dashboard should pull live data from various sources - your e-commerce platform, CRM, web analytics, and social media accounts - all into one centralized view. For example, connecting tools like Google Analytics, Shopify, and an inventory management system can significantly improve decision-making efficiency [7].
Make sure the platform is accessible across devices. Whether you're handling peak sales periods or addressing urgent issues, your dashboard should work just as well on a smartphone or tablet as it does on a desktop.
If you manage multiple advertising channels, consider platforms like Feedcast.ai. These tools consolidate ad accounts from Google, Meta, and Microsoft Ads into a single interface. This saves time by letting you monitor and manage campaigns without switching between platforms.
Setting Up KPIs for Your Business Goals
Once the platform is in place, align your KPIs with your business objectives. Metrics should directly reflect progress toward your goals, whether that's boosting revenue, improving customer retention, or streamlining operations.
For revenue-focused goals, track metrics like total sales, average order value, and conversion rates. If your focus is on building stronger customer relationships, prioritize metrics such as customer lifetime value and retention rates.
Keep it simple. A well-designed dashboard focuses on 8–12 key metrics that cover areas like sales, marketing, operations, and customer experience. Tracking too many metrics can lead to confusion and dilute the focus.
Set clear benchmarks. For instance, if your current conversion rate is 2.1%, aim for a realistic improvement - say, 2.5% - in the next quarter. These targets make it easier to see if you're on track or need to adjust your strategy.
Tailor dashboard views for different teams. Your marketing team might need to see ad spend, click-through rates, and customer acquisition costs, while the operations team focuses on inventory turnover and fulfillment metrics. Custom views ensure everyone gets the data they need without unnecessary clutter.
Creating Clear and Easy-to-Use Dashboards
After defining your KPIs, the next step is presenting them in a way that's easy to understand. Use clear visualizations and color coding - green for good, yellow for caution, and red for urgent issues - to make trends and priorities instantly recognizable.
Organize metrics hierarchically, placing the most critical ones at the top. This structure ensures that during busy times, the most important data gets noticed first.
Set appropriate refresh intervals for your data. Real-time metrics like traffic and sales should update continuously, while others, like customer lifetime value, might only need daily or weekly updates.
Simplify complex data by focusing on trends rather than individual numbers. For instance, a 30-day trend graph of conversion rates provides more actionable insight than a daily breakdown in a table.
Before rolling out your dashboard, test it with key team members. A trial period can reveal usability issues and gaps that might not have been obvious during the design phase. Gather feedback on clarity, missing elements, and areas for improvement.
Finally, schedule regular reviews - monthly or quarterly - to ensure your dashboard evolves with your business needs. This helps keep your metrics relevant and your layout effective for your team.
sbb-itb-0bd1697
Advanced Dashboard Features and Optimization Tips
Once you've set up a basic dashboard, adding advanced features can take it to the next level. These upgrades turn a simple reporting tool into a dynamic business intelligence system. Instead of just tracking performance, your dashboard can start predicting trends and spotting opportunities before they fully surface.
Real-time Data and Predictive Analytics
Real-time monitoring gives you the ability to act quickly when changes occur. By setting up automated alerts for critical thresholds, your system notifies you the moment key metrics deviate from expectations. This allows you to investigate and address issues immediately.
Predictive analytics takes it a step further by analyzing historical data to forecast future trends. For example, your dashboard can examine patterns from previous months or seasons to predict demand. With this insight, you can adjust inventory levels or fine-tune marketing budgets ahead of time.
"Real-time dashboards are great for those more savvy business owners or decision-makers who understand the need to look longitudinally at their marketing investment. The transparency always helps to strengthen long-term relationships." - Bodie Czeladka, Creative & Managing Director at Dilate Digital [8]
Your system can also flag unusual patterns - like sudden spikes in cart abandonment or unexpected drops in traffic - so you can address problems before they escalate. Predictive modeling further enhances decision-making by estimating metrics like customer lifetime value, seasonal demand shifts, and churn rates, helping you stay ahead of the curve.
Beyond simply monitoring trends, breaking down the data offers even more actionable strategies.
Data Segmentation and Custom Reports
Segmentation helps you uncover the "why" behind your numbers. By breaking down KPIs into smaller groups - such as customer types, traffic sources, or geographic regions - you can reveal insights that aggregated data might hide.
Start with customer segmentation. For instance, you might find that customers acquired through social media tend to have a higher lifetime value than those from other channels. Insights like these can guide you to allocate your marketing budget more effectively.
Geographic segmentation can pinpoint regional preferences. If certain states or cities consistently show higher conversion rates, you can adjust your advertising and inventory strategies to maximize those opportunities.
At the product level, segmentation helps identify which items are performing well and which aren't. Tracking metrics like profit margins, return rates, and customer satisfaction scores across product categories can inform smarter inventory and marketing decisions.
Custom reports are also essential for different stakeholders. Your CFO might need detailed monthly financial summaries, while your marketing team benefits more from weekly campaign analyses. Tailoring reports ensures everyone gets the information they need.
Time-based segmentation provides another layer of clarity. Comparing performance across weekdays versus weekends, seasonal shifts, or pre- and post-campaign periods helps you optimize operations and marketing timing.
These insights pave the way for automation, which can further streamline decision-making.
Automation and AI Features
Advanced dashboards equipped with automation and AI features can transform how you work. Instead of just reporting data, your dashboard becomes an active partner in decision-making. AI automates repetitive tasks, reduces human error, and uncovers insights that might otherwise take hours of manual analysis.
Automated data imports save time by pulling information directly from platforms like e-commerce tools, advertising accounts, email marketing software, and social media into one centralized view. This eliminates the need for manual updates.
AI-powered campaign optimization is another game-changer. It can automatically adjust your advertising efforts based on real-time performance. For example, the system might allocate more budget to high-performing campaigns while pausing underperforming ones without requiring manual intervention.
A report from McKinsey highlights the potential of AI in retail and consumer goods, estimating it could deliver $400 to $660 billion in annual value globally. Early adopters have reported benefits like a 15% reduction in logistics costs, a 35% improvement in inventory accuracy, and a 65% boost in service levels [10].
Natural Language Processing (NLP) adds another layer of capability. By analyzing unstructured data - like customer reviews, support tickets, and social media mentions - NLP can extract insights about customer sentiment and product feedback that traditional metrics might overlook.
Walmart's use of AI showcases these advantages. Their improved forecast accuracy cut errors by 30%, while optimized inventory management reduced stockouts by 20% and excess inventory by 15%, leading to significant cost savings [9].
Automated reporting and intelligent alerts ensure you stay informed about complex patterns. Even when individual metrics seem normal, these tools can highlight emerging issues or opportunities, keeping you one step ahead.
Using Feedcast.ai for E-commerce KPI Management
Feedcast.ai simplifies KPI management by blending automation, AI-driven optimization, and unified analytics into one platform. For e-commerce businesses in the U.S. juggling multiple ad channels, this tool transforms how you track performance and make informed decisions. Let’s dive into how Feedcast.ai streamlines your ad campaigns and KPI tracking.
Managing Multiple Advertising Channels in One Place
One of the toughest challenges for e-commerce businesses is keeping track of campaigns spread across platforms like Google, Meta (Facebook and Instagram), and Microsoft Ads. Feedcast.ai eliminates the hassle by connecting all your ad accounts into a single, unified dashboard. No more switching between platforms all day long.
This centralized system is especially useful for monitoring key metrics like return on ad spend (ROAS) and customer acquisition cost (CAC) across various channels. Instead of piecing together data from multiple sources, you get real-time visibility in one place.
The platform also makes campaign management easier. You can adjust bids, pause underperforming ads, and reallocate budgets directly from the dashboard. For U.S. businesses running time-sensitive campaigns, such as seasonal promotions or flash sales, this real-time control can make a big difference. You’ll know exactly which channels are driving the best results and can shift your budget accordingly to maximize ROI during critical sales periods.
AI-Powered Data Enhancement and Campaign Optimization
Feedcast.ai doesn’t just stop at automation - it takes it a step further with AI-powered data refinement and campaign optimization. It starts by improving your product data with AI-driven enrichment, enhancing titles, descriptions, and attributes. Better product data means higher visibility and click-through rates, which directly impact your KPIs.
The platform supports product imports from major e-commerce solutions like Shopify, WooCommerce, and Prestashop, as well as file formats like Google Sheets, CSV, and XML. This flexibility makes it a great fit for U.S. merchants using a variety of tools and platforms.
Feedcast.ai’s smart targeting features optimize crucial metrics, such as conversion rates and customer lifetime value. The AI learns from your campaign performance and automatically adjusts targeting to focus on the most engaged audiences. This reduces wasted ad spend and improves campaign efficiency.
As a certified Google CSS (Comparison Shopping Service) partner, Feedcast.ai can also help U.S. businesses save on Google Shopping campaigns, lowering cost-per-click rates and boosting your advertising ROI.
Complete Performance Analytics and Reporting
Feedcast.ai’s analytics tools offer the detailed insights you need to manage KPIs effectively. The unified dashboard provides real-time metrics across all connected ad channels, so you can instantly monitor performance and make adjustments as needed.
Custom reporting allows you to break down data by channel, product, audience, or campaign. This level of detail helps you pinpoint which products or campaigns are performing well and identify areas that need improvement. For example, you can analyze performance by region to see where your U.S. customers are most active or by acquisition source to find the channels delivering the highest lifetime value.
The platform tracks more than just basic metrics, offering in-depth KPI monitoring for revenue, conversion rates, and customer acquisition costs. It even calculates complex metrics like ROAS across multiple channels, giving you a clear view of your advertising effectiveness.
Tailored reports ensure every team gets the insights they need. Your finance team might require monthly ROI summaries, while your marketing team benefits from weekly updates on campaign performance. This flexibility ensures everyone stays informed and aligned.
Conclusion: Growing Your Business with E-commerce KPI Dashboards
E-commerce KPI dashboards have evolved into essential tools for businesses, turning raw data into meaningful insights that can drive growth. With real-time access to metrics like conversion rates, acquisition costs, and ROAS, businesses can make quicker, more informed decisions that directly impact performance.
The secret to leveraging these dashboards lies in selecting the right metrics that align with your business goals and presenting them in a way that inspires action. Whether you're analyzing sales trends, customer behavior, or operational efficiency, the dashboard should provide a clear snapshot of your business's current state and future trajectory.
Thanks to automation and AI, the days of manually pulling data are fading. These advancements save time and allow you to focus on refining strategies and responding swiftly to market shifts and customer trends.
Take Feedcast.ai, for instance. This platform combines unified analytics, AI-driven optimization, and multi-channel management into one seamless solution. With over 2,500 e-retail brands already onboard, it’s a prime example of how centralized KPI tracking can simplify complex advertising tasks while boosting performance across platforms like Google, Meta, and Microsoft Ads.
Its standout features include AI-powered product feed optimization and automated campaign management. By enriching product data and fine-tuning targeting automatically, businesses can enhance critical metrics without the need for constant manual adjustments.
For U.S.-based e-commerce brands, Feedcast.ai offers even more perks, such as reduced Google Shopping CPC, Google Ads credits, and free listings. These benefits not only cut advertising costs but also increase product visibility, improving bottom-line metrics.
Ultimately, the success of your e-commerce business hinges on your ability to measure, analyze, and act on performance data. When paired with AI-driven tools and unified analytics platforms, these dashboards can transform data into a powerful engine for sustainable growth.
FAQs
How can e-commerce businesses use KPI dashboards to boost customer retention?
E-commerce businesses can use KPI dashboards to keep a close eye on metrics like customer retention rate, customer lifetime value (CLV), and net promoter score (NPS). These metrics shed light on how loyal and satisfied customers are, helping businesses pinpoint trends and areas that might need attention.
With all this data displayed in a clear, visual format, businesses can track retention-focused KPIs in real time and identify customers who might be at risk of leaving. This paves the way for proactive measures such as personalized discounts, loyalty programs, or enhanced customer support to keep customers happy and engaged. Armed with these insights, companies can make smarter, data-backed decisions to build stronger customer relationships and fuel growth.
What are the benefits of using AI and automation in e-commerce KPI dashboards?
Using AI and automation in e-commerce KPI dashboards offers a range of advantages that can transform how businesses operate. For starters, it allows for real-time data analysis, delivering insights that businesses can act on immediately. This means faster, smarter decisions that keep up with the pace of the market.
Automation also takes over repetitive tasks, reducing the risk of human error and ensuring metrics are tracked with precision. On top of that, AI tools can spot patterns, forecast trends, and even recommend changes to fine-tune marketing strategies before issues arise.
By simplifying workflows and enabling smarter, data-driven decisions, AI and automation not only save time but also increase efficiency, improve ROI, and set the stage for steady, long-term success.
Why is real-time data monitoring in a KPI dashboard essential for e-commerce businesses during peak sales periods?
Real-time data monitoring in a KPI dashboard becomes especially important during high-pressure sales periods like Black Friday or the holiday shopping season. It gives businesses instant visibility into key metrics like sales performance, website traffic, and customer behavior. This means they can adjust marketing strategies, tweak ad campaigns, or manage inventory on the fly to meet demand and make the most of every opportunity.
Beyond tracking trends, real-time analytics also help businesses spot and fix problems - whether it’s a website glitch or a low-stock alert - before they disrupt the customer experience. By staying on top of these issues, companies can keep operations running smoothly, boost conversion rates, and ensure customers stay happy during critical sales events.
Yohann B.